In the competitive 2025 app landscape, success is no longer measured by download counts alone. It’s defined by how users interact with your app, its stability, and its performance under real-world conditions. For React Native teams, understanding and acting on the right data is crucial for survival and growth. When evaluating your app’s performance, it’s crucial to distinguish actionable insights from what are often dismissed as vanity metrics. Focusing on a core set of actionable indicators reveals the true health of your application, enabling smarter, faster decisions.
This guide cuts through the noise to pinpoint the most critical app metrics to track. We’ll move beyond simple definitions to explore why these metrics matter specifically for React Native development, how to measure them effectively, and how tools like CodePushGo can empower your team to instantly address issues and deploy enhancements. By the end of this article, you will have a clear, actionable framework for each key metric. You’ll learn how to shift from reactive fixes to a proactive, data-driven strategy. This approach helps boost user retention, minimize crashes, and ensure every Over-the-Air (OTA) update improves the user experience, solidifying your app’s position in the market.
1. 7 Essential App Performance Metrics for React Native in 2025
For development teams seeking a definitive, actionable framework for monitoring their React Native applications, CodePushGo’s guide, “7 Essential App Performance Metrics for React Native in 2025,” is an indispensable resource. It moves beyond theoretical discussions to provide a robust, data-driven methodology tailored specifically for the React Native ecosystem. This guide is a standout choice because it not only identifies the most critical app metrics to track but also directly integrates this knowledge with a powerful over-the-air (OTA) update platform, creating a seamless loop of monitoring, analysis, and deployment.

The content excels by focusing on metrics that have a direct and measurable impact on the end-user experience, such as app launch times, crash rates, memory usage, and API latency. This focus empowers developers to pinpoint performance bottlenecks with precision, ensuring that every update contributes positively to app stability and responsiveness. The true strength of this resource lies in its practical application. It’s designed to work in tandem with the CodePushGo platform, which offers real-time analytics, staged rollouts, and instant rollback capabilities, giving teams unparalleled control over their release cycles.
Key Features and Strategic Advantages
This guide is more than just a list; it’s a strategic blueprint for achieving operational excellence. It helps teams accelerate their iteration cycles by enabling data-backed decisions, ultimately leading to reduced downtime and improved app store ratings.
- Actionable Framework: Provides a clear structure for monitoring the most impactful performance metrics, eliminating guesswork.
- Integrated Analytics: Seamlessly connects performance data with CodePushGo’s OTA platform, allowing for real-time monitoring of updates.
- Risk Mitigation: Supports advanced deployment strategies like A/B testing and phased rollouts to validate changes with a subset of users before a full release.
- User-Centric Focus: Emphasizes metrics that directly correlate with user satisfaction, such as app speed and stability, helping to boost retention.
Once you’ve identified key performance metrics, understanding how to actively improving mobile app performance, whether in React Native or other frameworks like Capacitor, becomes the next crucial step. The principles outlined in the CodePushGo guide provide a solid foundation for these optimization efforts. For those looking to dive deeper into the discipline, CodePushGo also offers detailed guidance on application performance monitoring best practices.
Platform Accessibility and Usage
Access: The guide is available as a free blog post on the CodePushGo website, making it accessible to any developer or team without a paywall.
Ease of Use: While the guide itself is straightforward, fully leveraging its insights requires a working knowledge of React Native and familiarity with the CodePushGo platform. It is best suited for technical teams, including developers, release engineers, and product managers who are directly involved in the app development lifecycle.
Website: https://codepushgo.com/blog/app-performance-metrics/
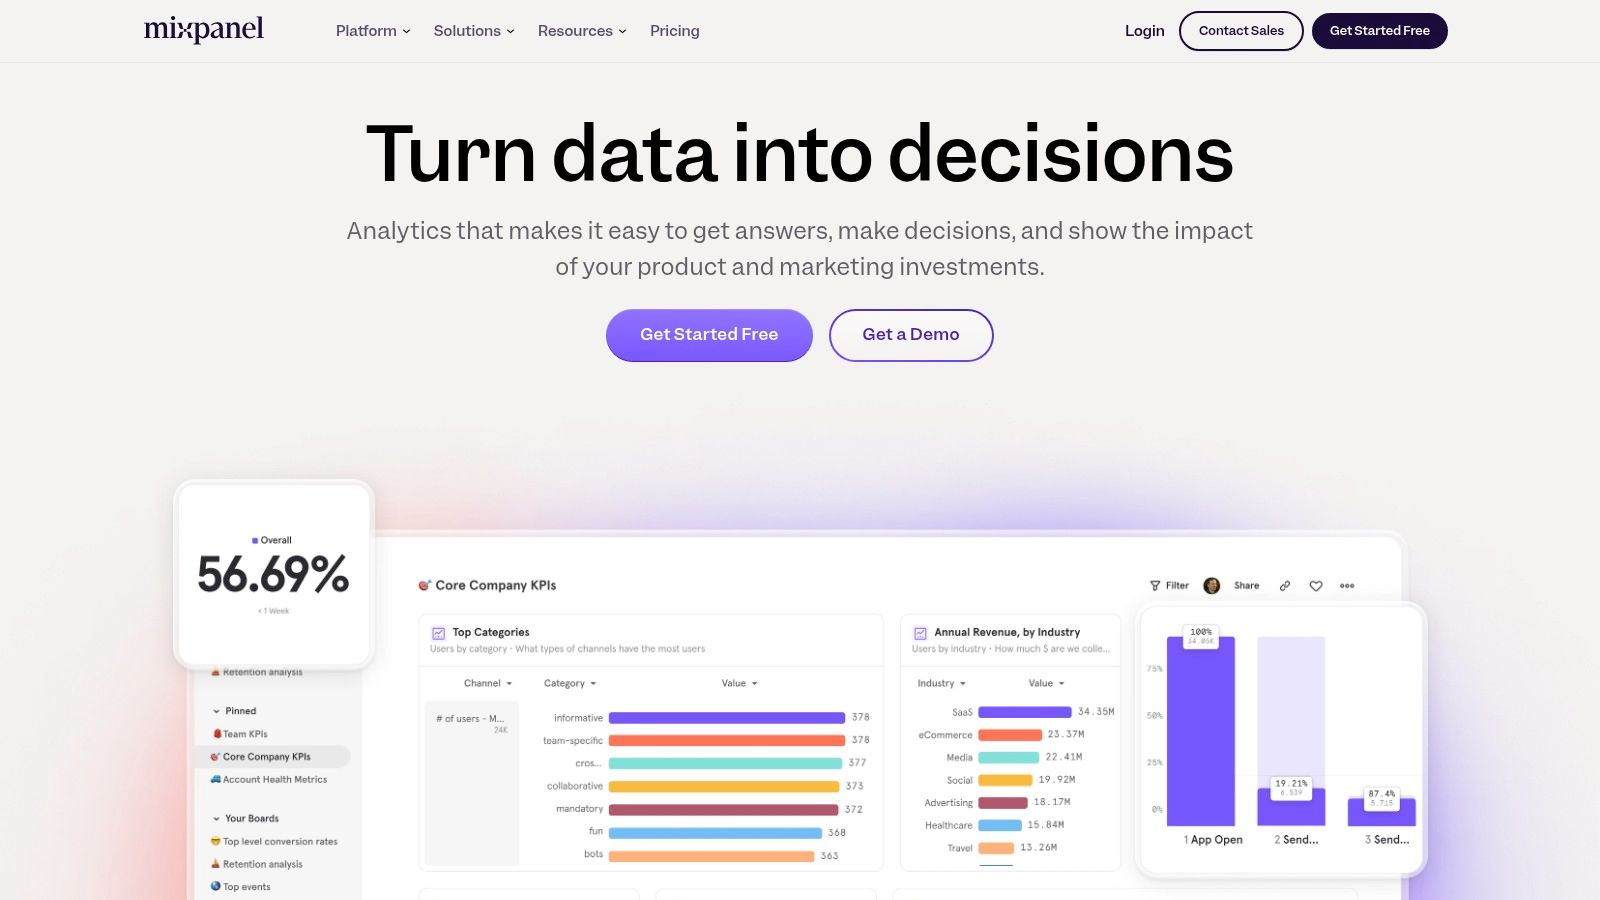
2. Mixpanel
For React Native teams seeking to move beyond basic analytics, Mixpanel offers a powerful, event-centric platform designed for deep user behavior analysis. It excels at answering complex questions about how users interact with your application, making it a critical tool for product managers and developers who need to understand the “why” behind their data. Instead of just tracking page views, Mixpanel allows you to define and monitor specific in-app events, such as a user completing a tutorial, using a new feature, or, crucially for CodePushGo users, successfully receiving an OTA update.
This granular approach to event tracking is what truly sets Mixpanel apart. It allows you to build sophisticated funnels, segment users with incredible precision, and perform cohort analysis to see how behavior changes over time. This makes it one of the most effective app metrics to track platforms for optimizing user journeys and boosting retention.
Key Features and Use Cases for React Native Teams
- Funnel Analysis: Visualize how users progress through critical flows, like onboarding or checkout. You can identify exactly where users drop off, enabling you to pinpoint UI/UX issues or bugs that need immediate attention.
- User Segmentation: Group users based on properties (e.g., app version, device type) or events they have performed. This is perfect for analyzing the adoption rate of a feature deployed via a CodePushGo update among a specific user segment.
- Retention Tables: Understand how well your app retains users over days, weeks, or months. You can compare retention rates between different cohorts, such as users who joined before and after a major feature release. For a deeper dive into this area, you can learn more about app engagement metrics and how they correlate with retention.
Pricing and Practical Advice
Mixpanel offers a generous free tier that includes most core features, making it accessible for startups and indie developers. Paid plans (Growth and Enterprise) unlock more advanced capabilities and higher data volume limits.
To get the most out of Mixpanel, define a clear tracking plan before implementation. Identify the key actions that signify user engagement and value in your app. This focused approach prevents data overload and ensures you’re collecting meaningful metrics from day one.
Website: https://mixpanel.com
3. Firebase by Google
For development teams looking for a comprehensive, all-in-one backend platform, Firebase by Google is an indispensable tool. It goes beyond simple analytics by offering a suite of tightly integrated products to build, improve, and grow apps. Its analytics component, Google Analytics for Firebase, automatically captures key events and user properties, providing a solid foundation for understanding user behavior right out of the box. This makes it an excellent choice for teams that need powerful analytics without a steep learning curve.
The true power of Firebase lies in its ecosystem. Analytics data doesn’t exist in a vacuum; it directly connects to other Firebase services like Crashlytics, A/B Testing, and In-App Messaging. This integration allows you to not only identify problems but also act on them from a single console, making it one of the most efficient app metrics to track solutions available for React Native developers.
Key Features and Use Cases for React Native Teams
- Real-Time Analytics & Crashlytics: Monitor user activity as it happens and receive detailed, real-time crash reports. When a new CodePushGo update causes an unexpected issue, Crashlytics helps you pinpoint the exact line of code responsible, enabling rapid fixes.
- A/B Testing with Remote Config: Experiment with UI changes, feature flags, or different user flows without deploying a new app version. You can target specific user segments, measure the impact on key metrics, and roll out the winning variant with Firebase Remote Config.
- Audience Segmentation: Create dynamic or static user audiences based on device data, custom events, or user properties. This allows you to deliver targeted in-app messages or push notifications to re-engage users who haven’t completed onboarding or adopted a new feature.
Pricing and Practical Advice
Firebase operates on a generous “Spark Plan” (free tier) which includes core features like Analytics, Crashlytics, and A/B Testing. For more extensive needs, the “Blaze Plan” offers pay-as-you-go pricing, ensuring the platform scales with your app’s growth.
To maximize Firebase’s value, leverage its integrated nature. For example, create an audience of users who experienced a specific crash and send them an in-app message once a fix is deployed. Given its deep integration with the Google ecosystem, it is also crucial to ensure your setup aligns with best practices; you can explore more on how to secure your backend with these app security standards.
Website: https://firebase.google.com
4. Amplitude
For teams prioritizing product-led growth, Amplitude provides a robust product analytics platform that offers deep, actionable insights into user behavior. It’s designed to help businesses understand the entire customer journey, from acquisition to retention, by focusing on how users interact with the app. For React Native teams, this means you can track detailed events, such as a user interacting with a newly deployed feature via CodePushGo, to measure its immediate impact on engagement.
Amplitude’s strength lies in its ability to connect product changes directly to business outcomes. It empowers product managers, marketers, and developers to make data-informed decisions by providing a clear view of what drives user behavior. This makes it an essential tool when deciding which app metrics to track to fuel growth and improve the user experience.
Key Features and Use Cases for React Native Teams
- Behavioral Cohorts: Go beyond simple demographics by grouping users based on specific actions they have (or have not) taken. This allows you to analyze how a certain CodePushGo update affects the behavior of your power users versus newly acquired users.
- Funnel and Retention Analysis: Build detailed funnels to see where users drop off in key flows and use retention charts to measure how long they stick around. You can compare retention curves between different app versions to validate the positive impact of your updates.
- Custom Dashboards: Create and share tailored dashboards that display the most relevant metrics for different stakeholders. A developer might focus on crash rates and performance, while a product manager tracks feature adoption and engagement KPIs.
Pricing and Practical Advice
Amplitude offers a free starter plan that is quite generous, making it accessible for early-stage projects. Paid plans (Plus and Growth) provide access to more advanced features like predictive analytics, higher event volume, and more collaboration tools. While the user-friendly interface simplifies data interpretation, the initial setup can be complex.
For the best results, start by mapping out your critical user journeys and identifying the key events within them. Don’t try to track everything at once; focus on the metrics that align with your primary business objectives to avoid getting lost in the data.
Website: https://amplitude.com
5. AppsFlyer
When the success of your React Native app hinges on understanding marketing ROI and user acquisition, AppsFlyer stands out as an essential platform. It is a leader in mobile attribution and marketing analytics, designed to help developers and marketers pinpoint which campaigns are driving valuable users. For teams that need to justify marketing spend and optimize acquisition channels, AppsFlyer provides the clarity needed to connect marketing efforts to in-app user actions.
AppsFlyer’s core strength lies in its ability to attribute app installs and subsequent events to specific marketing sources, from social media ads to influencer campaigns. This makes it an indispensable tool for measuring the effectiveness of your growth strategies and ensuring your marketing budget is wisely invested. By integrating its SDK, you can track the entire user journey, making it a critical platform for monitoring some of the most important app metrics to track for business growth.
Key Features and Use Cases for React Native Teams
- Mobile Attribution: Accurately track which marketing channels, campaigns, and ad creatives are driving installs. This helps you calculate the true cost per install (CPI) and identify your most profitable user acquisition sources.
- Marketing Analytics & ROI: Move beyond simple install counts and measure the lifetime value (LTV) of users from different channels. You can see which sources bring in users who engage more, make more purchases, or have higher retention rates.
- Fraud Prevention: Protect your marketing data and budget from fraudulent activities with AppsFlyer’s robust anti-fraud suite. This ensures your analytics are based on real user activity, leading to more accurate decisions. This focus on data integrity aligns with the principles of using quality automation tools for DevOps to ensure a secure and reliable pipeline.
- Deep Linking: Create seamless user experiences by directing users to specific in-app content from your marketing links. This is crucial for re-engagement campaigns and improving the onboarding flow for new users acquired through targeted ads.
Pricing and Practical Advice
AppsFlyer operates on a tiered pricing model, including a “Zero” free plan for startups and developers with up to 12,000 attributed non-organic installs. Paid plans (Growth and Enterprise) scale with your app’s growth, offering more advanced features and higher attribution volumes.
For an effective implementation, start by mapping out the key conversion events in your app (e.g., sign-up, tutorial completion, first purchase). Integrate these as in-app events in AppsFlyer to connect them back to your marketing campaigns. This will give you a full-funnel view of which channels are not just driving installs, but driving valuable, long-term users.
Website: https://appsflyer.com
6. Sensor Tower
While in-app tools focus on internal user behavior, Sensor Tower provides a crucial external perspective, offering a macro-level view of your app’s performance within the broader market. It’s an indispensable mobile intelligence platform for understanding competitive landscapes, app store trends, and user acquisition strategies. For React Native teams, this data is vital for benchmarking performance against rivals and identifying opportunities for growth and visibility in crowded app stores.
Sensor Tower empowers you to analyze download estimates, revenue data, and advertising strategies of any app, providing a complete picture of the mobile ecosystem. It shifts the focus from purely internal metrics to market-wide performance indicators, helping you understand how your app stacks up. This makes it a powerful platform for tracking app metrics to track from a competitive and strategic standpoint.
Key Features and Use Cases for React Native Teams
- App Store Intelligence: Monitor download and revenue trends for your app and your competitors. This helps you gauge market share, understand the impact of a competitor’s recent update, and set realistic growth targets.
- Ad Intelligence: Deconstruct the advertising strategies of other apps. You can see which ad networks they use, view their top creatives, and analyze their share of voice to inform your own user acquisition campaigns.
- Keyword Optimization (ASO): Identify and track the keywords your app and competitors are ranking for. This is essential for improving app store visibility and driving organic downloads, which is a critical first step before users can even experience your app’s features.
- Usage Intelligence: Get insights into user engagement and retention metrics across the market. This allows you to benchmark your app’s stickiness against industry averages and top performers in your category.
Pricing and Practical Advice
Sensor Tower is a premium, enterprise-focused platform, and its pricing is customized based on the data and features required. It is a significant investment best suited for established companies looking to gain a competitive edge. There is no free tier, but they do offer demos to showcase the platform’s capabilities.
For the best results, start by defining a core set of 3-5 direct competitors to monitor closely. Use the platform to track their updates, keyword changes, and promotional activities. Correlate this external market data with your internal metrics to build a holistic understanding of your app’s performance.
Website: https://sensortower.com
7. UXCam
For React Native teams aiming to understand not just what users do but why they do it, UXCam provides an unparalleled qualitative analytics platform. It moves beyond traditional quantitative data by offering visual insights into the user experience, allowing you to see your app through your users’ eyes with session replays, heatmaps, and gesture analysis. This is crucial for identifying friction points, bugs, or UI/UX flaws that numerical data alone cannot reveal.
UXCam’s core strength lies in its ability to provide context to your other analytics. When a user drops off from a checkout funnel, you can watch the session recording to see exactly where they struggled. This makes it an essential platform for product managers and designers who need to validate design choices and improve usability, making it a top-tier choice for teams looking to refine the crucial app metrics to track.
Key Features and Use Cases for React Native Teams
- Session Replay: Watch video-like recordings of user sessions to identify confusing UI elements, rage taps, or unexpected user behavior. This is invaluable for debugging issues reported by users or discovered during testing.
- Heatmaps and Gesture Recognition: Visualize where users tap, swipe, and interact most on each screen. This data helps optimize button placement, navigation, and overall layout for better engagement and easier navigation.
- Crash Analytics: When a crash occurs, UXCam provides a video recording of the session leading up to the event. This gives developers the exact sequence of actions that triggered the crash, drastically reducing debugging time. This can be especially powerful during the final stages of app development, a process you can refine by learning more about best practices for beta testing apps.
- User Segmentation: Filter session recordings and heatmaps by user properties like device, app version, or custom events. This allows you to analyze how a new feature deployed via CodePushGo is being used by a specific audience segment.
Pricing and Practical Advice
UXCam offers a free plan suitable for small projects or for evaluating the platform’s core features. Paid plans (Growth and Enterprise) scale based on the number of monthly sessions you need to record and offer more advanced features and data retention.
For the best results, integrate UXCam with your quantitative analytics tool. When you see a drop-off in a funnel on a platform like Mixpanel, use UXCam to watch the relevant session replays to understand the qualitative reason behind the drop. This combination of “what” and “why” provides a comprehensive view of your app’s performance.
Website: https://uxcam.com
7 Essential App Metrics Comparison
| Item | Implementation Complexity 🔄 | Resource Requirements ⚡ | Expected Outcomes 📊 | Ideal Use Cases 💡 | Key Advantages ⭐ |
|---|---|---|---|---|---|
| 7 Essential App Performance Metrics for React Native in 2025 | Medium: Requires React Native & CodePushGo knowledge | Moderate: Dev & platform integration | Improved app speed, stability, and responsiveness | React Native teams focusing on performance optimization | Real-time metrics, OTA updates, staged rollouts |
| Mixpanel | Medium: Setup can be resource-intensive | Moderate to High: Initial effort & cost | Real-time user behavior insights, enhanced engagement | Businesses seeking detailed user interaction analytics | User-friendly, real-time analytics, comprehensive docs |
| Firebase by Google | Medium: Broad toolset integration | Moderate to High: Pricing scales with usage | Comprehensive app analytics plus development tools | Developers wanting integrated analytics and app services | Google integration, scalability, full development platform |
| Amplitude | Medium-High: Complex setup possible | Moderate to High: Pricing can be high | Deep behavioral insights and retention analytics | Businesses needing detailed product usage and growth analysis | User-friendly, scalable, strong behavioral cohorts |
| AppsFlyer | High: Complex setup and integration | High: Resource and cost intensive | Enhanced marketing attribution and fraud prevention | Marketers tracking campaign performance and user acquisition | Fraud prevention, detailed marketing data, wide integrations |
| Sensor Tower | Low to Medium: Easy to adopt | Moderate to High: Pricing varied | Market and competitive intelligence for app economy insights | Businesses monitoring app store trends and competitor activity | Comprehensive app market data, competitor analysis |
| UXCam | Medium: Learning curve for detailed analytics | Moderate: Analytics and UX focus | Improved app usability via session replay and heatmaps | UX teams aiming to enhance design and user interaction | Visual user behavior insights, session replays, heatmaps |
Turn Metrics into Momentum with Agile OTA Updates
The journey to a successful mobile application is paved with data. As we’ve explored, understanding the critical app metrics to track is not just a technical exercise; it’s the foundation of a user-centric development strategy. From monitoring crash rates with Firebase to dissecting user funnels in Mixpanel and Amplitude, each metric tells a piece of your app’s story. Retention rates reveal your product’s stickiness, while session duration and engagement metrics show how deeply users connect with your features.
However, the true power of this data is unlocked not by observation, but by action. Identifying a critical bug or a drop-off point in your user journey is the first step. The second, more crucial step is responding with speed and precision. This is where the synergy between advanced analytics and an agile deployment strategy becomes a game-changer for React Native teams.
Bridging the Gap Between Insight and Implementation
The traditional app release cycle, with its lengthy waits for store review and approval, creates a significant lag between insight and implementation. You might spot a critical issue today, but the fix might not reach your users for days or even weeks. This delay can lead to user frustration, negative reviews, and ultimately, churn.
This is precisely the problem Over-the-Air (OTA) updates solve. By integrating a robust tool like CodePushGo into your workflow, you create a direct, real-time pipeline to your users’ devices.
Key Takeaway: The goal isn’t just to track metrics; it’s to shorten the feedback loop. The faster you can act on data, the more responsive and resilient your app becomes, creating a superior user experience that drives long-term success.
Your Actionable Next Steps
To transform your data into a competitive advantage, focus on creating a unified, actionable workflow. Here’s how to get started:
- Select Your Core Tools: Based on the tools we’ve covered, choose a primary analytics platform (like Firebase, Mixpanel, or Amplitude) that aligns with your product goals. Don’t try to use everything at once; start with one or two that provide the most relevant insights for your current stage.
- Define Your Key Performance Indicators (KPIs): Don’t just track metrics for the sake of it. Identify the 3-5 most important metrics that directly reflect your app’s health and business objectives. Are you focused on growth? Prioritize user acquisition and activation rates. Focused on stability? Make crash rates and OTA update success your north star.
- Integrate Analytics with Your Deployment Pipeline: This is the most critical step. Connect your analytics alerts directly to your development and release process. When your crash reporting tool flags a new issue, it should trigger an immediate investigation and, with a tool like CodePushGo, a rapid hotfix deployment.
- Establish a Cadence of Review and Action: Schedule regular meetings (weekly or bi-weekly) with your product, development, and QA teams to review the key app metrics to track. Use this time to celebrate wins, diagnose problems, and plan your next OTA update or feature sprint.
By diligently tracking the right metrics and empowering your team to act on them instantly, you move from a reactive to a proactive development culture. You stop just fixing problems and start building momentum, continuously refining your app to meet and exceed user expectations in an ever-evolving market.
Ready to close the gap between analytics and action? CodePushGo empowers your React Native team to deploy instant app updates, bug fixes, and feature improvements directly to users, bypassing the app store. Stop waiting and start shipping by integrating the industry’s most reliable and secure OTA update solution today. Visit CodePushGo to see how you can turn your app metrics into immediate momentum.