In the competitive world of mobile applications, a smooth user experience is not a luxury; it’s a requirement. For React Native developers, ensuring your app is fast, stable, and responsive is paramount to retaining users and achieving success. But how do you move from a subjective feeling of “it seems fast” to a data-driven understanding of your application’s health? The answer lies in tracking the right app performance metrics.
This guide cuts through the noise to provide a detailed overview of the most critical metrics you should be monitoring. We will explore key indicators that directly impact user satisfaction, from app launch times and crash rates to memory usage and API latency. For developers using CodePushGo for over-the-air updates, integrating these metrics provides a complete picture of how each release affects your app’s stability and performance in the real world.
Below, we detail the essential app performance metrics that every React Native team needs to track. We will cover what each metric means, why it’s important, and how to start monitoring it effectively. This isn’t just a list; it’s a blueprint for building a more resilient, high-performing application that delights your users with every interaction.
1. Startup Time: The Critical First Impression
A user’s first interaction with your React Native app sets the tone for their entire experience. Long startup times are a primary cause of user frustration and app abandonment. Studies consistently show that users expect mobile apps to load in two seconds or less; anything longer significantly increases the probability of them churning. Monitoring and optimizing this initial load is one of the most impactful app performance metrics you can track.
Startup time isn’t a single event but a sequence of processes. It can be broken down into two key phases:
- Cold Start: This occurs when the app is launched for the first time or after its process has been killed by the operating system (or the user). The OS needs to create the app process from scratch, load the framework, and initialize your application logic. This is the longest and most critical startup path to measure.
- Warm Start: This happens when the app is already in memory but was moved to the background. The OS simply brings the existing process to the foreground. While faster than a cold start, it’s still a crucial metric to monitor for a seamless user experience.
How to Measure and Improve Startup Time
For React Native developers, accurately measuring startup time requires looking beyond simple timers. The native side (Java/Kotlin for Android, Objective-C/Swift for iOS) and the JavaScript side both contribute to the total duration.
Measurement Tools & Techniques:
- Native Profiling: Use Xcode Instruments (Time Profiler) for iOS and Android Studio Profiler (CPU Profiler with System Trace) for Android to identify bottlenecks during the native initialization phase.
- React Native Flipper: The
react-native-performancelibrary integrates with Flipper, providing detailed timelines that show when the JS bundle starts loading, parsing, and executing. This helps you pinpoint slow JavaScript modules or complex initial render cycles. - Manual Timestamps: For custom tracking, you can log timestamps at key lifecycle events: from the native
main()oronCreate()methods to thecomponentDidMountof your root React component. Send these timings to your analytics service to track performance in the wild.
Actionable Insight: A common bottleneck is an oversized JavaScript bundle. Use a bundle analyzer like
react-native-bundle-visualizerto identify large, unnecessary dependencies. Aggressively code-split and consider using RAM bundles or inline requires to defer loading non-critical code until it’s actually needed, drastically improving your cold start times.
2. Datadog
Datadog provides an all-in-one, cloud-based monitoring and analytics platform that gives developers end-to-end visibility into their applications. For React Native developers, it consolidates infrastructure monitoring, application performance monitoring (APM), and log management, making it exceptionally powerful for tracking complex app performance metrics across the entire stack. This unified view is critical for diagnosing issues that span both the native and JavaScript layers of an app.
What sets Datadog apart is its ability to correlate data from disparate sources into a single, cohesive narrative. It can link a slow API response directly to a high CPU load on a specific server and a corresponding error log, all within one intuitive interface. This holistic approach saves invaluable time during incident response and debugging.
How to Measure and Improve with Datadog
Datadog’s RUM (Real User Monitoring) and APM products are the core tools for a React Native developer. After integrating its SDK, you can automatically capture a wealth of performance data from real user sessions without extensive manual instrumentation.
Measurement Tools & Techniques:
- Distributed Tracing: This feature allows you to trace a user’s request from the moment they tap a button in your app, through your backend services, and back. It visualizes the entire journey, highlighting bottlenecks in API calls, database queries, or third-party services.
- Real User Monitoring (RUM): Track key metrics like Core Web Vitals (for web-based views), load times, user-session replays, and JS errors directly from user devices. This provides a clear picture of real-world performance.
- Log Management: Collect, search, and analyze logs from both your React Native application and your backend infrastructure. You can correlate logs with traces and metrics to get the full context behind any performance degradation or crash.
Actionable Insight: Use Datadog’s customizable dashboards to create a specific “React Native Performance” view. Combine metrics like screen load times, JS error rates, and API latency on a single screen. Set up AI-powered anomaly detection on your most critical user flows, like checkout or login, to receive proactive alerts before users even report a problem. This comprehensive monitoring strategy is a key component of a robust CI/CD pipeline, much like the practices detailed in our guide on Android continuous integration.
3. New Relic
New Relic provides a comprehensive, full-stack observability platform that helps teams monitor, debug, and improve their entire software stack. For React Native developers, it offers a powerful mobile monitoring solution that goes beyond basic crash reporting to deliver deep insights into a wide array of app performance metrics, from network requests to UI render times. This unified approach allows you to correlate mobile performance directly with backend services, providing a complete picture of the user experience.
Unlike tools focused solely on crash analytics, New Relic’s strength lies in its holistic data collection. It captures performance data, errors, logs, and traces in a single, interconnected platform, making it an ideal choice for teams managing complex applications with multiple microservices. This integration is crucial for identifying whether a perceived slowdown in the app is due to client-side code, a network issue, or a problem with a backend API.
How to Measure and Improve with New Relic
Integrating New Relic into a React Native project is straightforward with their dedicated agent. Once installed, it automatically instruments key parts of your application, providing immediate visibility into critical performance areas.
Measurement Tools & Techniques:
- Mobile Monitoring Agent: The
newrelic-react-native-agentautomatically captures unhandled JavaScript errors, network request performance, and device-level information like memory and CPU usage. It also tracks interactions, which are user-defined logical units of work like “login” or “add to cart.” - Distributed Tracing: New Relic excels at connecting a mobile app’s request to the entire chain of backend services it touches. This allows you to trace a slow API call from the user’s tap all the way through your infrastructure to find the root cause.
- Custom Dashboards & NRQL: Use the New Relic Query Language (NRQL) to create custom dashboards. You can build charts that track specific app performance metrics, like the average response time for a critical API endpoint or the JavaScript error rate segmented by app version. This aligns with the best practices for application performance monitoring by tailoring visibility to your specific business goals.
Actionable Insight: Use New Relic’s “Interactions” feature to measure the performance of key user flows. By programmatically starting and stopping timers around multi-step processes (e.g., a checkout flow), you can identify which specific screen or network request within that flow is causing a bottleneck. This is far more powerful than just tracking individual screen loads.
4. AppDynamics
AppDynamics, a part of Cisco, offers an enterprise-grade Application Performance Monitoring (APM) platform that excels at connecting granular app performance metrics with tangible business outcomes. It moves beyond simple crash reporting to provide a holistic view of how your React Native application’s health impacts user engagement and revenue. For large organizations, this correlation is a critical differentiator.
This platform provides deep, end-to-end visibility, tracing user interactions from the mobile app through backend services and databases. This makes it exceptionally powerful for debugging complex issues that span multiple systems in a hybrid or multi-cloud environment.
- End-to-End Transaction Monitoring: AppDynamics maps the entire user journey, allowing developers to see precisely where bottlenecks occur, whether in the React Native code, a backend API call, or a database query.
- Business Performance Correlation: It directly links technical metrics like response times and error rates to business KPIs such as conversion funnels and user session length, providing a common language for development and business teams.
- AI-Driven Root Cause Analysis: The platform uses machine learning to automatically identify the root cause of performance anomalies, significantly reducing the time spent on diagnostics.
How to Leverage AppDynamics for React Native
AppDynamics provides a dedicated SDK for React Native that captures a wide range of performance data automatically, including network requests, crashes, and UI performance. Its strength lies in contextualizing this data within the broader application ecosystem.
Key Features & Implementation:
- Session Monitoring: Track detailed user sessions to understand usage patterns, identify rage taps, and see where users struggle or drop off. This goes beyond simple analytics by tying behavior directly to performance.
- Network Request Analysis: Automatically instrument
fetchandXMLHttpRequestcalls to monitor the performance of your API endpoints. You can see latency, data transfer sizes, and HTTP errors for every request your app makes. - Crash & Error Reporting: Get detailed crash reports complete with stack traces that span both the JavaScript and native layers of your React Native application, providing a complete picture for debugging. For a deeper dive into creating effective monitoring views, you can learn more about building an application performance monitoring dashboard.
Actionable Insight: Use AppDynamics’ Business Journeys feature to map critical user flows in your app, such as user registration or the checkout process. By defining these key funnels, you can set up alerts that trigger not just on technical errors but on business-level deviations, like a sudden drop in successful checkouts, allowing you to proactively address issues that directly impact your bottom line.
5. Dynatrace
Dynatrace provides an enterprise-grade, AI-powered observability platform that goes beyond traditional application performance monitoring. It offers a comprehensive, full-stack view, automatically discovering and mapping all components of your application environment, from the frontend user interaction down to the underlying cloud infrastructure. This automated, all-in-one approach is crucial for managing the complex dependencies inherent in modern React Native applications.
The platform’s core strength lies in its AI engine, Davis®, which automates root-cause analysis. Instead of just presenting you with data and dashboards, Dynatrace proactively identifies performance degradations, pinpoints the exact cause, and quantifies the business impact. This is a significant advantage for development teams looking to reduce manual troubleshooting time and focus on building features.
Key Features and Use Cases for React Native
Dynatrace’s capabilities are particularly well-suited for tracking complex app performance metrics in a hybrid environment like React Native.
Platform Highlights:
- Real User Monitoring (RUM): Capture every user click, tap, and swipe to analyze user journeys, identify rage taps, and understand how performance issues directly impact user behavior. Combining these performance insights with user engagement metrics provides a holistic view of the app’s health. You can discover more about app engagement metrics and how they complement performance data.
- AI-Powered Root Cause Analysis: The Davis AI engine automatically correlates native crashes, JavaScript errors, slow network requests, and infrastructure problems to give you a single, actionable answer instead of a flood of alerts.
- Full-Stack Observability: Seamlessly trace a single user action from the React Native UI through your backend services and databases, regardless of where they are hosted. This is invaluable for debugging issues that span both the client and server.
Actionable Insight: Use Dynatrace’s user session replay to visually diagnose bugs and UI/UX issues reported by users. By watching a recreation of a user’s journey, you can see exactly where they encountered a JavaScript error or a slow API response, dramatically shortening the time it takes to reproduce and fix the problem. This moves you from reactive bug fixing to proactive user experience optimization.
6. Site24x7
Site24x7 offers a comprehensive, all-in-one monitoring solution that extends beyond typical application performance monitoring to cover the entire IT infrastructure. For React Native teams, this means gaining visibility not just into the app’s behavior but also into the backend services, APIs, and servers it relies upon. This holistic view is crucial for diagnosing issues that originate outside the mobile client, making it a powerful tool for DevOps and full-stack developers.
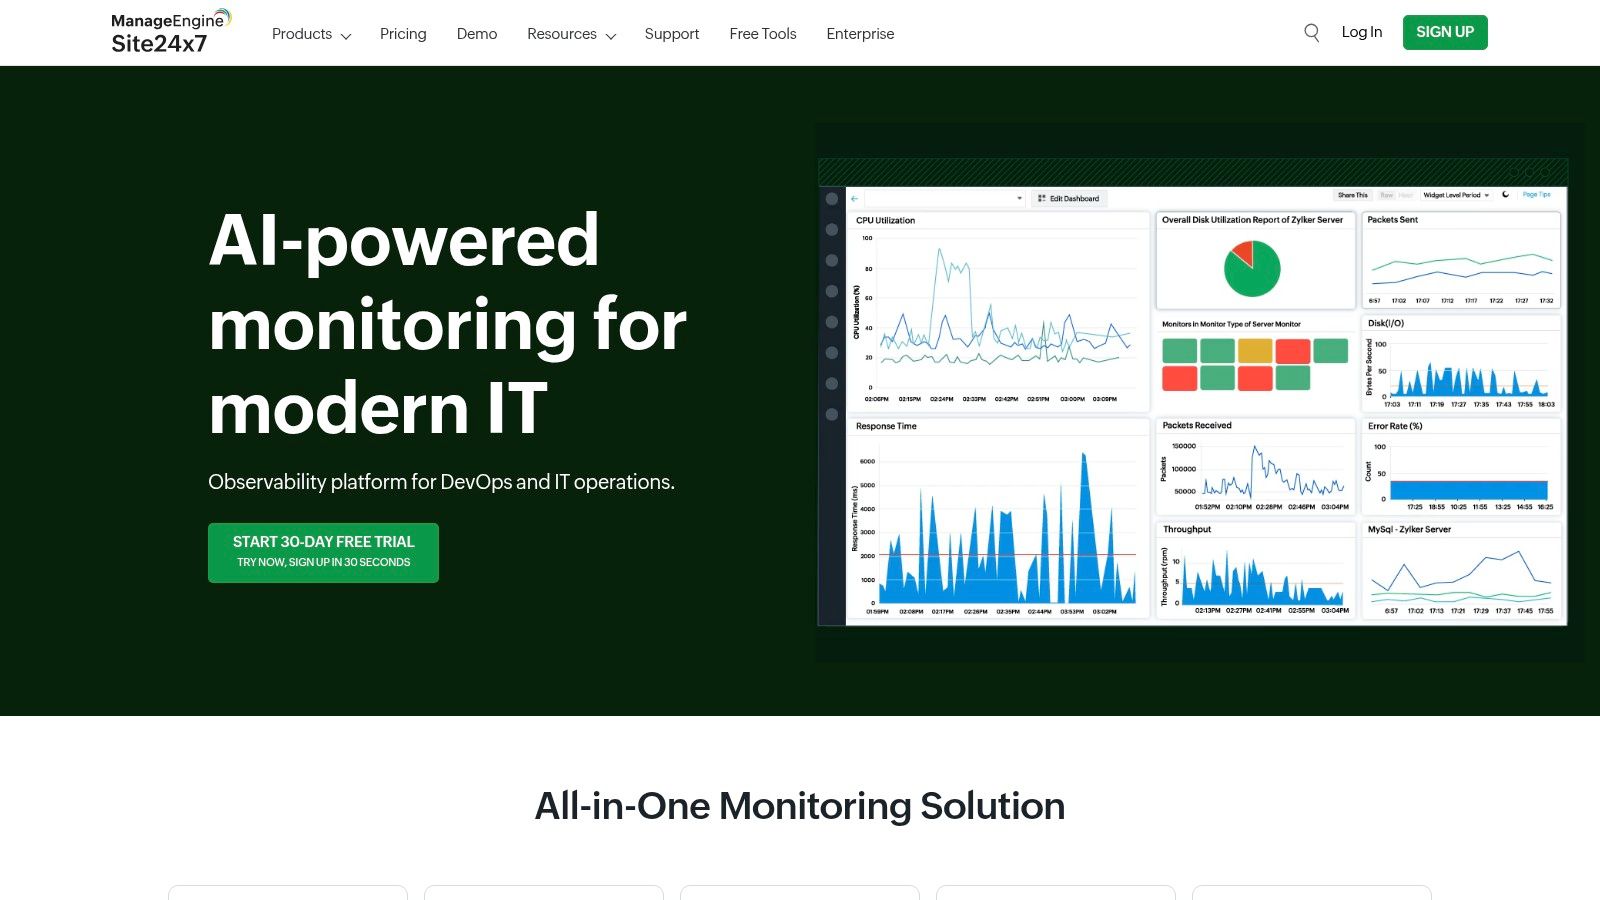
Its strength lies in correlating mobile app performance with backend health. For instance, a sudden spike in network latency within your React Native app can be immediately traced back to a struggling API endpoint or a database server under load, all within a single, unified dashboard. This capability significantly reduces the mean time to resolution (MTTR) for complex, multi-layered problems.
How to Measure and Improve with Site24x7
Site24x7’s platform is designed to connect user experience data directly with infrastructure performance, providing a clear path from problem identification to resolution. It empowers teams to monitor a wide array of crucial app performance metrics.
Measurement Tools & Techniques:
- Real User Monitoring (RUM): Deploy the Site24x7 RUM agent in your web-based assets or backend to capture real-time performance data from actual user sessions. This helps track page load times, AJAX calls, and JavaScript errors that directly impact the user-facing components of your ecosystem.
- APM Insight: For your backend services (built on Java, .NET, Node.js, etc.), APM Insight provides deep-level code visibility. It automatically discovers and maps application dependencies, traces distributed transactions, and identifies slow database queries or external API calls that are bottlenecking your React Native app’s performance.
- Synthetic Monitoring: Proactively test critical user journeys and API endpoints from global locations. You can simulate user interactions to ensure key features like login, search, or checkout are always available and performant, catching issues before they affect real users.
Actionable Insight: Use the platform’s alerting and reporting features to create a performance baseline for your backend APIs. Set up alerts for when API response times exceed a certain threshold (e.g., 500ms). When an alert triggers, you can use the distributed tracing feature to immediately see the entire request lifecycle, pinpointing whether the latency is in your application code, a database query, or a third-party service, allowing for a precise and rapid fix.
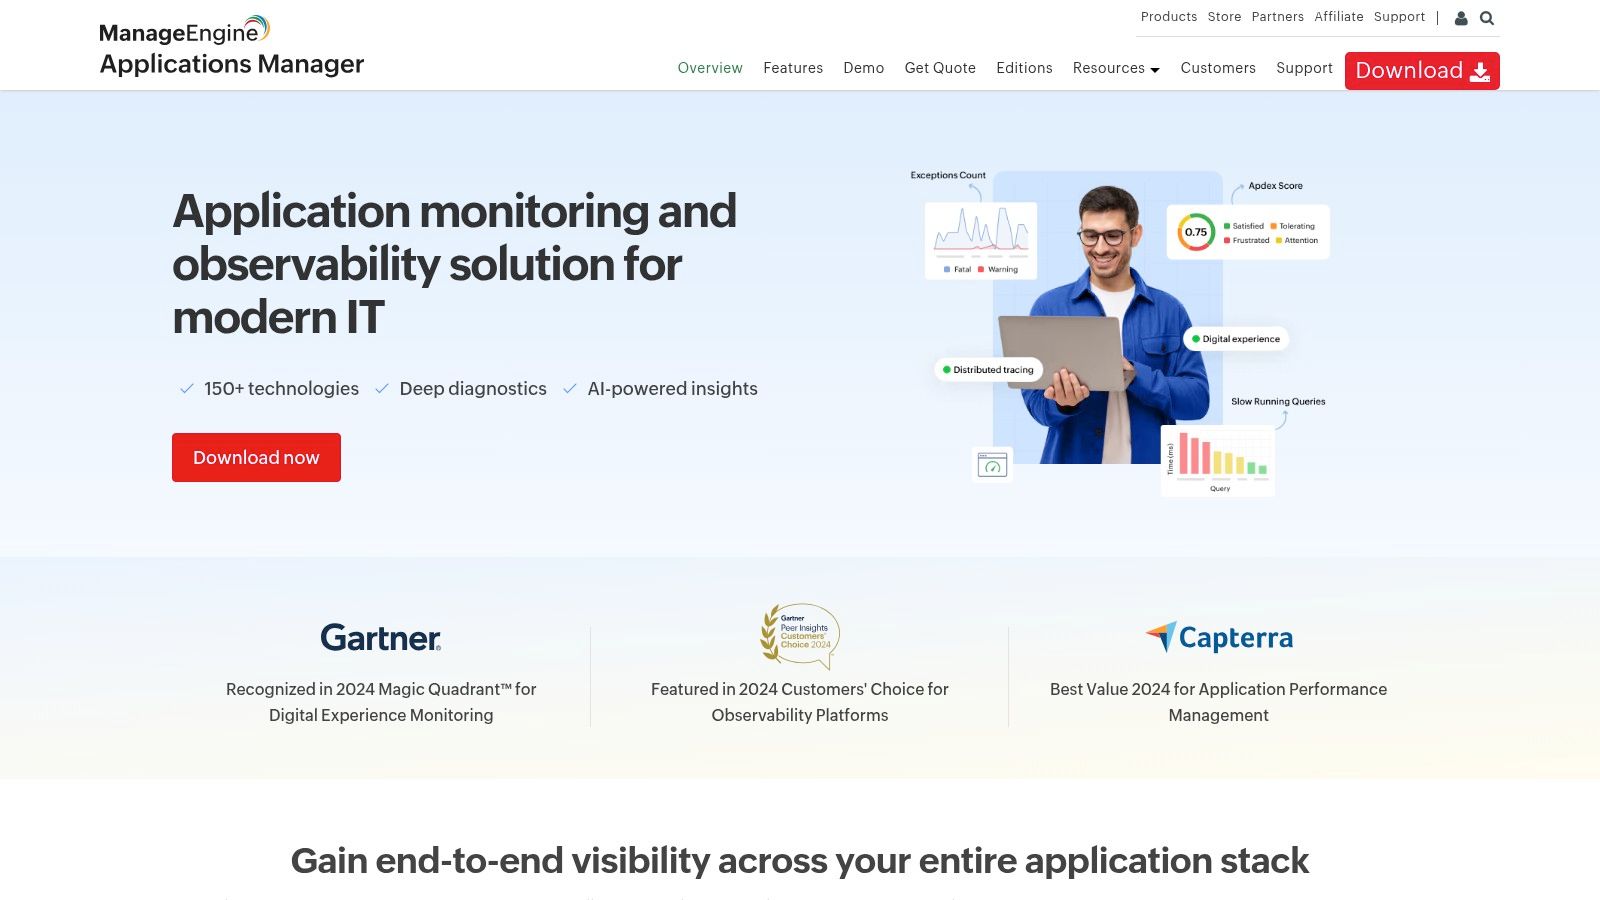
7. ManageEngine Applications Manager
ManageEngine Applications Manager offers a robust and comprehensive solution for monitoring the complete technology stack, extending far beyond just the mobile application layer. For development and DevOps teams, it serves as a unified platform to track the health and performance of the servers, databases, and microservices that power your React Native app. This holistic view is crucial for diagnosing issues where the root cause lies within the backend infrastructure, not the client-side code.
Where many tools focus solely on the frontend, Applications Manager provides deep visibility into the entire service delivery chain. It stands out as a cost-effective choice for small to medium-sized businesses that need enterprise-grade monitoring capabilities without the associated price tag. Its strength lies in connecting your app’s performance metrics to the underlying server and database performance, providing a clear path from user-facing lag to the specific overloaded server or slow database query causing it.
How to Measure and Improve with Applications Manager
While not a dedicated React Native profiler, Applications Manager is instrumental in monitoring the backend services your app relies on. By ensuring your infrastructure is healthy, you directly improve key mobile app performance metrics like API response times and data fetch durations.
Measurement Tools & Techniques:
- Automated Discovery: Use the platform’s discovery feature to automatically map all your backend components, including servers, databases, and APIs. This creates a complete dependency map, showing how different parts of your infrastructure interact to serve your mobile app.
- Real-User Monitoring (RUM): While the core strength is backend monitoring, its RUM capabilities can track key web-based transaction performance from different geographic locations, which is invaluable if your app includes web views or relies on web-based authentication flows.
- Customizable Dashboards: Create dashboards that correlate frontend metrics (like API latency measured in your app) with backend metrics (like server CPU usage and database query times). This allows you to instantly see if a spike in app latency corresponds to a problem on your backend.
Actionable Insight: Set up synthetic transaction monitoring for your critical API endpoints. This feature proactively simulates user requests to your backend services at regular intervals. By doing this, you can detect and get alerted to backend degradation or outages before they impact a significant number of your React Native app users, allowing you to fix issues before they become widespread problems.
App Performance Metrics Comparison of Top 7 Tools
| Product | Implementation Complexity 🔄 | Resource Requirements ⚡ | Expected Outcomes 📊 | Ideal Use Cases 💡 | Key Advantages ⭐ |
|---|---|---|---|---|---|
| CodePushGo | Moderate (CI/CD setup fee, React Native focus) | Moderate (one-time setup cost, React Native environment) | Fast, secure OTA code updates with real-time analytics | React Native apps needing instant, compliant OTA updates | Instant background updates, end-to-end encryption, smart differential updates, flexible deployment |
| Datadog | Moderate (initial learning curve) | High (scalable for large environments) | Comprehensive infrastructure & app monitoring with AI | Large, dynamic environments needing full-stack monitoring | Extensive integrations, real-time dashboards, AI anomaly detection |
| New Relic | Moderate to High (advanced features setup) | Moderate to High (depends on usage scale) | Centralized telemetry with real-time insights | Diverse environments requiring full-stack observability | Unified telemetry, extensive integrations, flexible pricing |
| AppDynamics | High (complex setup for large environments) | High (enterprise-level resources) | Deep application/business insights with AI analysis | Large enterprises needing business performance correlation | AI-driven root cause analysis, hybrid cloud support, scalable |
| Dynatrace | Moderate to High (learning curve for advanced) | High (complex/cloud-native environments) | Automated, AI-powered full-stack monitoring | Complex, cloud-native and hybrid environments | AI problem detection, automated discovery, proactive insights |
| Site24x7 | Low to Moderate (easier setup) | Low to Moderate (budget-friendly SMB focus) | Broad monitoring across web, infra, network layers | Small to medium businesses with multi-layer monitoring | Affordable, real user monitoring, synthetic tests |
| ManageEngine Applications Manager | Moderate (initial configuration effort) | Low to Moderate (cost-effective SMB tool) | Detailed app/server/db monitoring with reports | SMBs needing cost-effective monitoring with ITSM integration | Broad technology support, customizable alerts, user-friendly reports |
From Metrics to Mastery: A Continuous Improvement Loop
Navigating the landscape of app performance metrics can feel overwhelming, but as we’ve explored, the right tools and a focused strategy can transform raw data into a powerful engine for growth and user satisfaction. We’ve journeyed through a comprehensive suite of solutions, from the specialized over-the-air update capabilities of CodePushGo to the broad, enterprise-grade observability platforms like Datadog, New Relic, and Dynatrace. Each tool offers a unique lens through which to view your React Native application’s health.
The core takeaway is that monitoring is not a passive activity; it’s the first step in a continuous improvement loop. The ultimate goal isn’t just to collect data points on crash rates, CPU usage, or network latency. The real objective is to translate those app performance metrics into actionable insights that lead to a more stable, responsive, and engaging user experience. By understanding these key indicators, your team can proactively identify bottlenecks, squash bugs before they impact a wider audience, and make informed decisions about future development priorities.
Actionable Next Steps for Your Team
To move from simply tracking metrics to achieving performance mastery, consider the following strategic steps:
- Establish Baselines: Before you can improve, you need to know where you stand. Implement your chosen tool and let it run for a period to establish a clear performance baseline for your key user journeys. This becomes your benchmark for all future updates.
- Define Your “North Star” Metrics: Don’t try to track everything at once. Identify the 3-5 app performance metrics that are most critical to your app’s success and user experience. This could be TTI for a content-heavy app or API error rates for a data-intensive one.
- Integrate Monitoring into Your Workflow: Performance monitoring shouldn’t be an afterthought. Integrate it directly into your CI/CD pipeline. Set up automated alerts to notify your development and DevOps teams of critical regressions or anomalies, allowing for rapid response.
Choosing the Right Tool for the Job
Your choice of tool should align directly with your team’s specific needs and scale.
- For teams prioritizing rapid, targeted bug fixes and feature rollouts with minimal store review friction, a specialized tool like CodePushGo is invaluable.
- For large-scale enterprise applications requiring deep, end-to-end observability across complex infrastructures, platforms like AppDynamics or New Relic provide comprehensive, all-in-one solutions.
- For teams seeking a balance of powerful monitoring and ease of use, Datadog and Site24x7 offer robust feature sets that are accessible to a wider range of technical roles.
Ultimately, mastering your app performance metrics is an ongoing commitment to quality. It’s about building a culture where performance is a shared responsibility, from product managers to QA engineers. By leveraging these powerful tools and adopting a proactive, data-driven approach, you can ensure your React Native app not only functions but thrives, delighting users with every interaction.
Ready to take control of your app’s stability and release cycle? While comprehensive APM tools monitor performance, CodePushGo empowers you to act on those insights instantly. Push critical bug fixes and updates directly to your users’ devices without waiting for app store approval, turning performance data into immediate improvements. Start your free trial with CodePushGo today and accelerate your continuous improvement loop.