Unlocking Peak Application Performance
Application performance is crucial for user satisfaction and business success. Slowdowns and errors cost revenue and damage reputation. This listicle delivers eight application performance monitoring best practices to help React Native developers, DevOps, QA, security, and product teams pinpoint and resolve performance bottlenecks. Mastering these application performance monitoring best practices ensures a smooth, high-performing application experience. Learn how to define service level objectives, utilize distributed tracing, monitor real user experiences, implement proactive alerting, optimize database performance, monitor infrastructure, establish performance baselines, and integrate performance monitoring into your CI/CD pipeline.
1. Establish Comprehensive Service Level Objectives (SLOs)
A cornerstone of application performance monitoring (APM) best practices is the establishment of comprehensive Service Level Objectives (SLOs). SLOs are specific, measurable targets for application performance that directly align with business requirements and user expectations. They provide a crucial framework for defining acceptable performance levels and guiding teams to focus on the metrics that truly matter to the end-users, contributing significantly to a positive user experience. This approach shifts the focus from purely technical metrics to business-centric goals, ensuring that development efforts prioritize user satisfaction and business value. This is crucial for anyone involved in the application lifecycle, from React Native app developers and DevOps engineers to product managers and security-conscious organizations.
SLOs consist of quantifiable performance targets encompassing key areas like latency (how quickly your application responds), availability (how often your application is accessible), and throughput (how much data your application can handle). For instance, a latency SLO might specify that 99% of user requests should be served within 200ms. An availability SLO might target 99.99% uptime. Throughput could be measured as the number of transactions processed per second. These targets are not arbitrary but are tied to business needs and user expectations. By defining these objectives, organizations can establish clear performance expectations across teams, enabling data-driven decision-making regarding infrastructure investments and prioritization of performance issues based on their potential business impact.
A key component of SLOs is the concept of error budgets. An error budget defines the acceptable level of deviation from the SLO. This allows teams a degree of flexibility to balance reliability with the velocity of feature development. For example, if your availability SLO is 99.99%, your error budget allows for 52.6 minutes of downtime per year. This framework encourages proactive management of performance and fosters informed decisions about when to prioritize bug fixes versus new feature deployments.
Successfully implemented SLOs can be observed in industry giants. Google’s 99.9% availability target for Google Search, Netflix’s 99.99% streaming availability SLO, and Shopify’s 200ms response time target for checkout processes are prime examples of how SLOs translate into tangible performance goals. These companies prioritize user experience by setting ambitious yet achievable targets, demonstrating the effectiveness of SLOs in driving high performance and reliability.
Establishing SLOs offers significant advantages, including clearer performance expectations across teams, data-driven decision-making for infrastructure investments, prioritization of performance issues based on business impact, and facilitated communication between technical and business stakeholders. However, this approach also presents challenges. Defining meaningful SLOs for complex systems requires significant upfront planning and stakeholder alignment. There’s also the potential risk of teams “gaming” the metrics to meet SLO targets rather than genuinely improving the user experience. Therefore, careful planning, continuous monitoring, and regular review are vital.
Here are some actionable tips for effectively implementing SLOs:
- Start with user-centric metrics: Focus on metrics that directly impact user experience, such as page load time and error rates.
- Use percentiles, not averages, for latency SLOs: The 99th percentile (p99) provides a more accurate picture of real-world user experience than the average, as it captures the experience of the majority of users while still accounting for outliers.
- Begin with achievable targets and gradually tighten them: Start with attainable SLOs and progressively raise the bar as your system matures and your understanding of user needs deepens.
- Include both availability and performance metrics: A holistic approach considering both availability and performance provides a comprehensive view of application health.
The following infographic visualizes the key steps involved in establishing and utilizing SLOs. This process begins with defining the SLOs themselves, focusing on crucial metrics like latency and availability. Subsequently, error budgets are established to allow flexibility in managing performance. Finally, these metrics are aligned with overall business goals, ensuring that performance targets directly support business success.
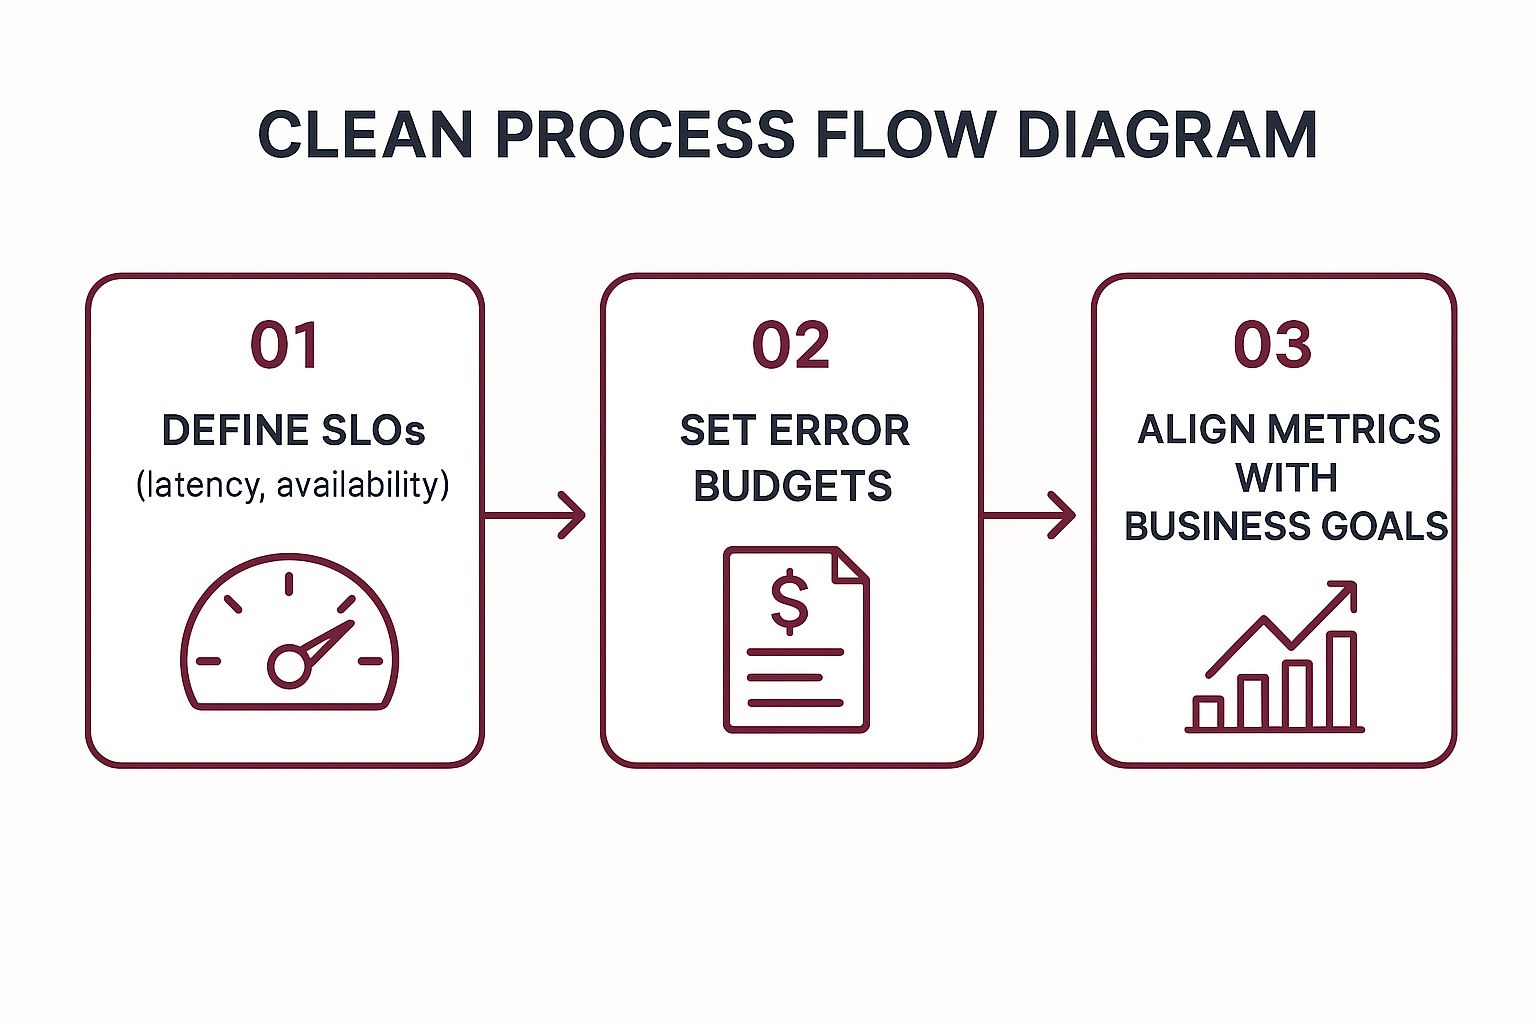
The infographic highlights the sequential and interconnected nature of defining SLOs, setting error budgets, and aligning metrics with business goals. This process ensures that performance targets are not only technically sound but also contribute to the overall success of the business.
The concepts of SLOs and error budgets were popularized by the Google SRE team and Ben Treynor, playing a key role in their Site Reliability Engineering practices. By adopting these best practices, development teams, QA testers, and product managers can build and maintain high-performing applications that meet user expectations and drive business value. This proactive, user-centric approach is essential for navigating the complexities of modern application development and ensuring a positive user experience.
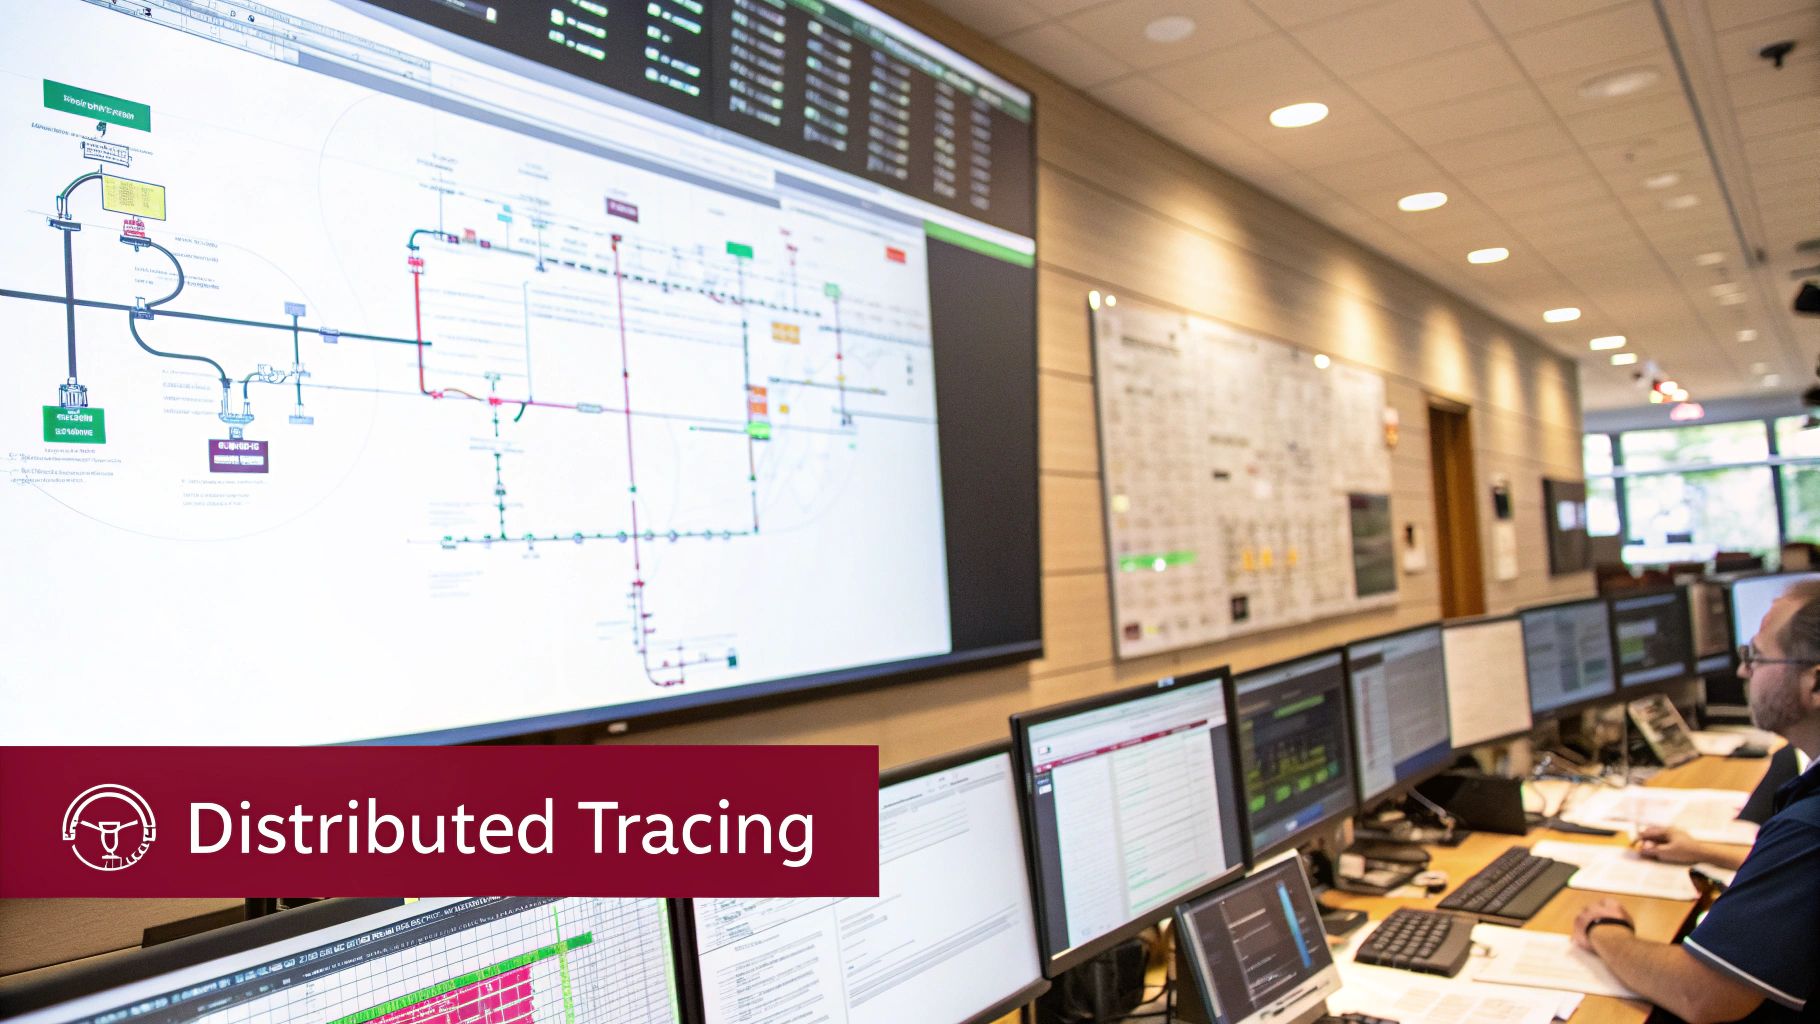
2. Implement Distributed Tracing
In today’s complex microservices architectures, understanding how requests perform across multiple services is crucial for optimal application performance monitoring. This is where distributed tracing comes in as a best practice. Distributed tracing is a technique that tracks requests as they propagate through distributed systems, offering end-to-end visibility into application performance. By capturing detailed timing information and contextual data for each request, distributed tracing helps pinpoint bottlenecks, latency issues, and dependencies within your application infrastructure. It’s especially vital for React Native app developers, DevOps and release engineers, QA and beta testing teams, security-conscious enterprises, and product managers seeking real-time insights into application behavior.
Distributed tracing works by assigning a unique identifier, often called a trace ID, to each incoming request. As the request traverses different services and components, this trace ID is propagated along with it. Each service adds its own timing information and contextual data (spans) to the overall trace, creating a comprehensive timeline of the request’s journey. This allows you to see exactly how long each service took to process the request, identify any slowdowns or errors, and understand the dependencies between different services.
Features of effective distributed tracing systems include:
- End-to-end request tracking across service boundaries: Provides visibility into the complete lifecycle of a request, regardless of the number of services involved.
- Trace correlation with unique identifiers: Links all operations related to a single request using trace IDs and span IDs.
- Service dependency mapping: Automatically discovers and visualizes the relationships between different services.
- Performance breakdown by service and operation: Pinpoints performance bottlenecks within specific services or operations.
- Context propagation across different technologies: Ensures consistent tracing across heterogeneous environments.
For example, Uber utilizes Jaeger to track ride requests across over 1000 microservices, allowing them to rapidly diagnose and address performance issues. Similarly, Twitter employs Zipkin to monitor the performance of tweet delivery, ensuring a smooth user experience. Airbnb leverages distributed tracing to optimize their booking flow, minimizing latency and maximizing conversion rates. These examples highlight the significant benefits of implementing distributed tracing for application performance monitoring.
Pros of Implementing Distributed Tracing:
- Complete visibility into complex distributed systems: Provides a clear understanding of how requests flow through your application.
- Enables root cause analysis for performance issues: Helps identify the specific service or operation responsible for performance bottlenecks.
- Helps identify service dependencies and bottlenecks: Reveals hidden dependencies and potential points of failure.
- Supports capacity planning and optimization efforts: Provides data-driven insights for optimizing resource allocation and scaling.
Cons of Implementing Distributed Tracing:
- Can introduce performance overhead if not implemented carefully: Requires careful configuration and sampling strategies.
- Requires instrumentation across all services and technologies: Can be challenging to implement in legacy systems.
- May generate large amounts of trace data requiring storage and processing: Requires robust data storage and analysis solutions.
- Complex to implement in legacy systems: May require significant code changes and refactoring.
Tips for Successful Implementation:
- Start with critical user journeys and high-traffic services: Focus your initial efforts on the most important parts of your application.
- Use sampling strategies to manage trace volume and costs: Reduce the overhead of tracing by selectively collecting traces.
- Implement trace correlation in logs and metrics for comprehensive debugging: Integrate tracing data with other monitoring tools for a holistic view.
- Choose OpenTelemetry for vendor-neutral instrumentation: Avoid vendor lock-in and ensure interoperability.
Distributed tracing is an essential best practice for application performance monitoring, especially for complex distributed systems. By providing granular insights into request flow and performance, it allows you to proactively identify and address bottlenecks, optimize resource utilization, and deliver a seamless user experience. Its place in this list is well-deserved as it addresses the growing complexity of modern applications and provides the tools needed to ensure optimal performance in a distributed environment. Pioneered by the Google Dapper team and further popularized by organizations like Uber Engineering and communities like OpenTracing and OpenTelemetry, distributed tracing has become a critical component of modern application performance management.
3. Monitor Real User Experience (RUM)
Real User Monitoring (RUM) is a crucial aspect of application performance monitoring that focuses on capturing and analyzing performance data from actual user interactions. This provides invaluable insights into how users experience your application’s performance in real-world scenarios, accounting for variations in devices, networks, geographic locations, and user behavior. Unlike synthetic monitoring, which simulates user interactions in a controlled environment, RUM captures the authentic user experience, uncovering performance bottlenecks that might otherwise be missed. By understanding how real users interact with your app, you can pinpoint and address performance issues that directly impact user satisfaction, engagement, and ultimately, your bottom line. This makes RUM an indispensable tool for anyone involved in delivering high-quality applications, from developers to product managers.

RUM works by injecting a small JavaScript snippet into your application’s front-end. This snippet collects performance data as users interact with your app, tracking metrics like page load times, resource loading times, user interactions (e.g., clicks, scrolls), and network conditions. This data is then transmitted to a RUM platform for analysis and visualization. The insights gleaned from this data can be segmented by user demographics, geographic location, device type, browser, and more, providing a granular view of performance across different user segments. For example, you might discover that users in a specific region are experiencing significantly slower load times due to network latency, or that a particular feature is underperforming on older mobile devices.
The benefits of RUM are substantial. It allows you to:
- Identify performance issues affecting specific user segments: Pinpoint problems affecting specific demographics, geographic locations, or device types, enabling targeted optimization efforts.
- Correlate performance with business metrics: Understand the impact of performance on key business indicators like conversion rates, bounce rates, and user retention. For example, Walmart’s RUM implementation revealed a direct correlation between faster load times and increased revenue.
- Detect issues that synthetic monitoring might miss: Capture real-world performance issues related to user behavior, network variability, and device-specific quirks that simulated tests might not uncover.
- Prioritize performance improvements based on real-world impact: Focus development efforts on addressing the performance issues that have the most significant impact on actual users.
However, RUM is not without its drawbacks. Some considerations include:
- JavaScript instrumentation impact: The JavaScript snippet required for data collection can potentially impact page load performance, although the impact is typically minimal with modern RUM tools.
- Privacy concerns: Collecting user interaction data raises privacy concerns. Ensure your RUM implementation complies with data privacy regulations and provides users with transparency and control over their data.
- Data volume management: RUM can generate large volumes of data, especially for high-traffic applications. Implementing data sampling strategies can help manage data volume and cost.
- Limited server-side visibility: RUM primarily focuses on front-end performance. While it can provide some insights into server-side performance bottlenecks, dedicated server-side monitoring tools are typically required for comprehensive backend performance analysis.
Examples of successful RUM implementations abound. Walmart, by improving load times by just 1% through RUM insights, saw a 2% increase in revenue. Pinterest optimized their Core Web Vitals, reducing bounce rate by a remarkable 40%. Similarly, the BBC used RUM data to uncover mobile performance issues significantly impacting user engagement. These examples highlight the tangible business value that RUM can deliver. Learn more about Monitor Real User Experience (RUM) for detailed information on its implementation and benefits.
For React Native developers, DevOps engineers, QA testers, and product managers seeking real-time insights into application performance, RUM is an essential tool. Here are some actionable tips for effective RUM implementation:
- Focus on Core Web Vitals (LCP, FID, CLS): These metrics are crucial for both SEO and user experience, providing a standardized way to measure key aspects of perceived performance.
- Segment data by user demographics, geography, and device types: Gain granular insights into performance variations across different user segments to tailor optimization efforts.
- Correlate performance metrics with business KPIs: Understand how performance impacts your bottom line and prioritize improvements based on business impact.
- Use sampling for high-traffic sites to manage data volume: Reduce data volume and cost while still capturing representative user experience data.
By incorporating RUM as a core component of your application performance monitoring strategy, you can ensure that your application delivers a seamless and engaging experience for all users, regardless of their device, location, or network conditions. This proactive approach to performance optimization translates to improved user satisfaction, increased engagement, and ultimately, greater business success.
4. Set Up Proactive Alerting and Incident Response
In the realm of application performance monitoring (APM) best practices, establishing a proactive alerting and incident response system is paramount. This involves creating intelligent alerting systems that notify teams of performance issues before they significantly impact users, combined with well-defined incident response procedures. This proactive approach shifts the focus from reactive firefighting to early detection and rapid resolution, minimizing downtime and enhancing user experience. This is crucial for maintaining a healthy application and retaining users, making it a cornerstone of application performance monitoring best practices.

A robust proactive alerting system utilizes a combination of features to achieve its goals. Multi-threshold alerting with escalation policies ensures that the right people are notified at the right time, depending on the severity of the issue. Anomaly detection, often powered by machine learning, identifies unusual patterns in performance data that might indicate emerging problems. Alert correlation and noise reduction mechanisms help filter out irrelevant alerts and focus attention on genuine issues, preventing alert fatigue. Finally, integration with incident management platforms streamlines the entire incident response workflow, from initial alert to resolution and post-mortem analysis. Automated runbook execution can further expedite the process by triggering pre-defined remediation steps.
Real-world examples demonstrate the power of proactive alerting and incident response. Netflix, renowned for its robust infrastructure, utilizes chaos engineering combined with predictive alerting to proactively identify and address potential weaknesses in their system. Spotify has implemented sophisticated anomaly detection that has reduced false positive alerts by a staggering 80%, freeing up their engineering teams to focus on critical issues. PagerDuty, a leader in incident management, uses its own incident response automation to reduce mean time to resolution (MTTR) by 65%, showcasing the tangible benefits of this approach.
For React Native developers, DevOps engineers, and QA teams, implementing proactive alerting is crucial for maintaining a stable and performant application. Real-time insights into application performance allow for swift identification and resolution of issues, minimizing disruption to users. Security-conscious enterprise organizations benefit from the enhanced security posture that proactive alerting provides, helping to prevent security breaches and data leaks. Product managers can leverage performance data to make informed decisions about feature development and prioritization. You might find the content at this link insightful regarding related deployment strategies: Learn more about Set Up Proactive Alerting and Incident Response.
Here are some actionable tips for implementing effective proactive alerting and incident response:
- Use multiple metrics for alert conditions: Relying on a single metric can lead to false positives. Combine multiple relevant metrics to create more accurate and reliable alert conditions.
- Implement alert escalation based on severity and response time: Ensure that alerts escalate to the appropriate personnel based on the severity of the issue and the lack of response.
- Create runbooks with clear step-by-step resolution procedures: Well-defined runbooks empower teams to quickly diagnose and resolve issues, minimizing downtime.
- Test alerting systems regularly with simulated incidents: Regular testing helps identify gaps in your alerting and response procedures and ensures that your systems are functioning as expected.
While proactive alerting and incident response offers significant advantages, it’s important to be aware of the potential drawbacks. Configuring optimal thresholds and avoiding false positives can be complex and requires ongoing tuning and maintenance. If not properly managed, proactive alerting can create an on-call burden and lead to alert fatigue. The cost of implementing and maintaining multiple alerting channels can also be a factor.
Despite these challenges, the benefits of proactive alerting and incident response far outweigh the drawbacks. By reducing MTTD, preventing minor issues from escalating, enabling faster incident resolution through automation, and reducing alert fatigue, this approach significantly improves application performance, user experience, and team efficiency. It is a crucial component of any comprehensive application performance monitoring strategy and deserves its place among the best practices. Tools like PagerDuty and Opsgenie, popularized by companies like Netflix, offer robust solutions for implementing and managing proactive alerting and incident response systems.
5. Optimize Database Performance Monitoring
Database performance is often the Achilles’ heel of application performance. A slow database can cripple even the most meticulously crafted application, leading to frustrating user experiences and lost revenue. Therefore, optimizing database performance monitoring is a crucial best practice in application performance monitoring (APM). This involves implementing comprehensive monitoring that delves into the intricacies of database operations, providing insights into query execution times, connection pooling, index usage, and resource consumption. By understanding these key metrics, you can identify bottlenecks, optimize performance, and ensure your application remains responsive and reliable. This practice is particularly vital for React Native app developers, DevOps and release engineers, QA and beta testing teams, security-conscious enterprise organizations, and product managers seeking real-time insights.
Effective database performance monitoring provides a granular view into how your application interacts with its database. It goes beyond simple uptime checks and delves into the specifics of individual queries, connections, and resource usage. This level of detail allows you to pinpoint the exact source of performance bottlenecks, whether it’s a poorly written query, inefficient indexing, or resource contention. By monitoring query execution times, you can identify slow queries that are impacting overall application performance. Analyzing connection pool behavior helps ensure that your application can efficiently access database resources. Tracking index usage allows you to optimize query execution plans and avoid costly full table scans. Finally, monitoring resource utilization, including CPU, memory, and I/O, provides a comprehensive understanding of the database server’s health and capacity.
Several key features are essential for comprehensive database performance monitoring:
- Query performance analysis and slow query detection: This identifies long-running queries that impact application responsiveness.
- Database connection pool monitoring: This ensures efficient management of database connections, preventing connection exhaustion and application slowdowns.
- Index usage and optimization recommendations: This helps optimize query execution by leveraging appropriate indexes.
- Lock contention and deadlock detection: This pinpoints concurrency issues that can lead to performance degradation.
- Resource utilization tracking (CPU, memory, I/O): This monitors the overall health and capacity of the database server.
Implementing effective database performance monitoring yields several significant benefits:
Pros:
- Identifies the most common source of application performance issues, often originating within the database.
- Enables proactive optimization before problems escalate and impact end-users.
- Provides critical insights for capacity planning and informed scaling decisions.
- Facilitates the optimization of expensive database operations, reducing overall costs.
Cons:
- Database monitoring can impact database performance itself if not configured properly, requiring careful calibration.
- Requires database-specific expertise to interpret metrics effectively and derive actionable insights.
- May expose sensitive data, necessitating robust security considerations and access controls.
- Can be complex to monitor across multiple database technologies, requiring specialized tools and expertise.
Real-world examples demonstrate the power of database performance monitoring: Stack Overflow utilizes SQL Server monitoring to prevent performance degradation during traffic spikes. GitHub employs MySQL performance monitoring and query optimization to ensure responsiveness. LinkedIn leverages database monitoring across diverse data stores like MySQL and Cassandra to maintain performance across their complex infrastructure. Learn more about Optimize Database Performance Monitoring to delve deeper into these concepts.
When implementing database performance monitoring, consider these actionable tips:
- Monitor both application-level and database-level metrics: This provides a holistic view of performance, enabling accurate diagnosis of issues.
- Set up alerts for long-running queries and connection pool exhaustion: This allows for proactive intervention before problems become critical.
- Use explain plans to understand query execution strategies: This helps optimize queries for optimal performance.
- Monitor replication lag in distributed database setups: This ensures data consistency and prevents performance bottlenecks caused by replication delays.
Popular APM tools like Percona, DataDog, and New Relic offer robust database monitoring capabilities. These tools provide pre-built dashboards, alerts, and reporting features that simplify the process of monitoring and analyzing database performance.
By prioritizing database performance monitoring as a key component of your application performance monitoring strategy, you can proactively identify and address performance bottlenecks, ensuring a smooth and responsive user experience, even under demanding conditions. This is a critical aspect of application performance monitoring best practices and should be an integral part of your overall development and operations strategy. Your users, and your bottom line, will thank you.
6. Implement Infrastructure and Resource Monitoring
Effective application performance monitoring (APM) isn’t solely about tracking application code. It requires a holistic approach, including deep visibility into the underlying infrastructure. Implementing infrastructure and resource monitoring is a critical best practice for understanding how the health and performance of your servers, networks, and other resources directly impact the user experience of your React Native application. This practice provides the foundational layer for identifying performance bottlenecks and ensuring the stability of your application. By monitoring key metrics, you can proactively address potential issues before they escalate and negatively impact your users.
Infrastructure and resource monitoring involves tracking various metrics related to your infrastructure components. These include CPU utilization, memory usage, disk I/O operations, network latency, and bandwidth consumption. For containerized applications, monitoring extends to container health, resource limits, and the performance of the orchestration platform, such as Kubernetes. In cloud environments, this also encompasses monitoring cloud-specific resources like load balancers, databases, and message queues. Gathering these metrics provides a complete picture of how your infrastructure is performing and how it interacts with your application.
For example, high CPU utilization on your database server could lead to slow query responses, directly impacting the loading time of data within your React Native application. Similarly, network latency between your application servers and your users could result in sluggish performance and a frustrating user experience. By monitoring these metrics, you can quickly identify the root cause of such issues and take corrective action.
Several features are essential for comprehensive infrastructure monitoring. These include tools and systems that provide real-time visibility into CPU, memory, disk, and network utilization across all your servers and infrastructure components. For teams leveraging containers and orchestration platforms, specialized monitoring tools are crucial for understanding the performance of individual containers and the overall cluster. In cloud environments, resource monitoring and cost optimization features are vital for managing cloud spend and ensuring efficient resource allocation. Finally, capacity planning and auto-scaling metrics are essential for predicting future resource needs and automatically adjusting resources based on demand.
Implementing infrastructure and resource monitoring offers significant advantages:
- Provides a foundational understanding of performance constraints: By monitoring infrastructure metrics, you can pinpoint the underlying causes of performance bottlenecks and understand how resource limitations impact your application.
- Enables proactive scaling and capacity planning: Historical infrastructure data helps predict future resource requirements, allowing you to proactively scale your infrastructure and avoid performance issues during peak usage.
- Helps optimize cloud costs through resource right-sizing: By monitoring resource utilization, you can identify underutilized resources and right-size your cloud instances to minimize costs.
- Essential for troubleshooting performance issues: When performance problems arise, infrastructure monitoring data is invaluable for identifying the root cause and quickly resolving the issue.
However, infrastructure monitoring also presents certain challenges:
- Can generate overwhelming amounts of low-level data: Managing and interpreting the sheer volume of data generated can be complex and require specialized tools.
- May not directly correlate with user experience issues: While infrastructure metrics are crucial, they don’t always provide a direct link to user-perceived performance. Correlating infrastructure data with application performance metrics is essential.
- Requires expertise to interpret infrastructure metrics: Understanding the nuances of various infrastructure metrics requires specialized knowledge and experience.
- Different monitoring approaches needed for various infrastructure types: Monitoring on-premise infrastructure differs significantly from monitoring cloud-based environments, requiring tailored approaches.
Companies like Netflix, Spotify, and Dropbox have successfully implemented sophisticated infrastructure monitoring strategies to ensure the performance and reliability of their services. Netflix monitors its vast cloud infrastructure across multiple AWS regions, while Spotify uses Kubernetes monitoring to track the performance of its microservices architecture. Dropbox relies heavily on storage infrastructure monitoring to ensure optimal file sync performance. These examples demonstrate the importance of infrastructure monitoring for large-scale, complex applications.
Here are some actionable tips for implementing effective infrastructure and resource monitoring:
- Correlate infrastructure metrics with application performance data: This provides a holistic view of how infrastructure impacts user experience.
- Set up predictive alerts for resource exhaustion: Proactive alerts allow you to address potential issues before they impact users.
- Monitor infrastructure dependencies and external services: Identify potential bottlenecks in external systems that your application relies on.
- Use infrastructure as code to ensure consistent monitoring setup: Automating your monitoring setup ensures consistency and reduces manual errors.
Learn more about Implement Infrastructure and Resource Monitoring
Popularized by communities and organizations like the Prometheus community, Grafana Labs, HashiCorp, and the Cloud Native Computing Foundation (CNCF), infrastructure monitoring has become an indispensable part of modern application performance monitoring best practices. By incorporating these techniques into your DevOps workflow, you can ensure the stability, performance, and scalability of your React Native application, delivering a seamless experience for your users.
7. Establish Performance Baselines and Trending
One of the most crucial application performance monitoring (APM) best practices is establishing performance baselines and trending. This involves creating a historical record of your application’s performance under normal operating conditions and continuously tracking its performance over time. This practice enables you to understand what constitutes “normal” for your application and quickly identify deviations, whether they are sudden drops or gradual degradation, which might otherwise go unnoticed. This is vital for maintaining optimal application performance and ensuring a positive user experience. For React Native app developers, DevOps and release engineers, QA and beta testing teams, security-conscious organizations, and product managers, understanding performance baselines is key to proactive performance management.
This method works by collecting and analyzing performance data over extended periods. The data collected can include metrics like response times, error rates, CPU usage, memory consumption, and network latency. By analyzing this data, you establish a “baseline” representing the expected performance of your application under typical usage patterns. With this baseline in place, you can then monitor ongoing performance and compare it against this established norm. Any significant deviation from the baseline can signal a potential problem requiring investigation.
The benefits of establishing performance baselines and trending are numerous. It allows for the detection of gradual performance degradation, which can be difficult to spot without historical context. Imagine a slow memory leak that incrementally increases response times over several weeks. Without a baseline, this degradation might go unnoticed until it becomes a significant performance bottleneck. Trending also supports capacity planning by revealing historical growth patterns. By analyzing how resource usage has evolved over time, you can better predict future needs and proactively scale your infrastructure to prevent performance issues. Furthermore, baselines are invaluable for understanding the impact of code changes on performance. By comparing performance before and after a deployment, you can quickly identify regressions and pinpoint the responsible code changes. For security-conscious organizations, consistent performance baselines can also help identify anomalous behavior that could indicate a security breach.
Several features contribute to effective baseline and trending analysis. These include tools and systems capable of historical performance data collection and analysis, recognizing seasonal and cyclical patterns, detecting performance regressions in deployments, analyzing capacity growth trends, and enabling comparative analysis across different time periods. Modern APM solutions often incorporate these features, providing a comprehensive platform for baseline management.
Several companies have successfully implemented performance baseline and trending practices. Amazon, for example, leverages performance baseline tracking during peak shopping seasons like Black Friday and Cyber Monday to ensure their systems can handle the surge in traffic. LinkedIn uses performance trending to identify gradual performance degradation in their feed, enabling them to address issues proactively before they impact user experience. Etsy utilizes performance baselines to analyze the impact of deployments, ensuring new code doesn’t negatively affect application performance.
While the benefits are significant, there are some challenges associated with establishing and maintaining performance baselines. Long-term data retention can be expensive, and baselines can become outdated as application functionality evolves. Seasonal variations, such as increased traffic during holidays or specific times of the day, can complicate baseline establishment. Additionally, baselines may not accurately account for sudden, unpredictable changes in user behavior or traffic patterns.
To effectively implement performance baselines and trending, consider the following tips:
- Establish baselines for different traffic patterns and user segments: Recognize that “normal” performance might vary depending on the time of day, day of the week, or the specific user group interacting with your application.
- Update baselines regularly to account for application changes: As your application evolves with new features and code updates, your baselines need to be updated to reflect these changes. Consider automating this process wherever possible.
- Use statistical methods to account for normal variation: Performance will naturally fluctuate within a certain range. Leverage statistical methods to define acceptable thresholds and avoid false positives.
- Correlate performance trends with deployment and infrastructure changes: This helps pinpoint the root cause of performance issues and facilitates faster resolution.
Pioneered by industry leaders like the Google SRE team, Netflix Engineering, and Etsy Engineering, the practice of establishing performance baselines and trending is a cornerstone of effective application performance management. By incorporating this best practice into your APM strategy, you can proactively address performance issues, optimize resource utilization, and ensure a consistently positive user experience.
8. Integrate Performance Monitoring into CI/CD Pipeline
One of the most effective application performance monitoring best practices is integrating performance testing and monitoring directly into your Continuous Integration/Continuous Deployment (CI/CD) pipeline. This proactive approach shifts performance considerations left, making them an integral part of the development process rather than an afterthought. By catching performance regressions early, before they reach production, you can significantly reduce the cost and effort of fixing performance issues and ensure a consistently positive user experience. This practice is crucial for maintaining optimal application performance and is especially beneficial for React Native app developers, DevOps and release engineers, QA and beta testing teams, security-conscious enterprise organizations, and product managers seeking real-time insights.
This method works by embedding automated performance tests at various stages of your CI/CD pipeline. These tests can range from simple smoke tests that check basic functionality and response times to more complex load tests that simulate real-world user traffic. When a code change is committed, the CI/CD pipeline automatically triggers these tests. If the performance metrics fall below pre-defined thresholds or a regression is detected, the pipeline can be halted, preventing the problematic code from being deployed to production. This automated process ensures that performance remains a top priority throughout the development lifecycle.
Features of integrating performance monitoring into your CI/CD pipeline include:
- Automated performance testing in CI/CD pipelines: This automates the execution of performance tests whenever new code is integrated, providing consistent and frequent performance checks.
- Performance regression detection before production deployment: By identifying performance degradation early in the development cycle, you can prevent these issues from impacting end-users.
- Load testing integration with deployment processes: Simulating real-world user traffic helps identify potential bottlenecks and ensures your application can handle expected loads.
- Performance budgets and gates in deployment pipeline: Defining acceptable performance thresholds (budgets) and implementing gates that prevent deployments if these thresholds are not met ensures that performance remains within acceptable limits.
- Automated rollback based on performance metrics: If a deployment leads to performance degradation in production, automated rollback mechanisms can quickly revert to the previous stable version, minimizing user impact.
There are numerous examples of successful implementation of this best practice: Google utilizes performance budgets in web development to prevent regressions, ensuring their web applications maintain consistent performance. Facebook employs continuous performance testing for their mobile applications, catching performance issues early and maintaining a high-quality user experience. Shopify integrates automated load testing before high-traffic events like Black Friday, ensuring their platform can handle the surge in user activity.
While the benefits are substantial, there are some potential drawbacks: Setting up and configuring performance tests within the CI/CD pipeline requires an initial investment of time and resources. There’s also the risk of false positives, where tests fail due to issues unrelated to the code changes, potentially blocking legitimate deployments. Finally, achieving accurate results requires creating realistic test environments that effectively mirror production traffic patterns, which can be challenging.
To effectively implement performance monitoring in your CI/CD pipeline, consider the following tips:
- Start small and gradually increase complexity: Begin with basic performance smoke tests and progressively add more sophisticated tests like load tests and stress tests.
- Use performance budgets to define acceptable performance thresholds: Establish clear performance goals and implement gates in your pipeline to enforce these budgets.
- Implement gradual rollouts with performance monitoring: Deploy new code to a small subset of users first and monitor performance before releasing it to the wider audience.
- Create realistic test environments that mirror production traffic patterns: Use production-like data and traffic patterns in your test environment to ensure accurate and reliable performance testing.
Integrating performance monitoring into your CI/CD pipeline offers significant advantages. It prevents performance regressions from reaching production, makes performance a primary concern in development, enables rapid feedback on the performance impact of code changes, and reduces the cost of fixing performance issues. Learn more about Integrate Performance Monitoring into CI/CD Pipeline to gain a deeper understanding of how to implement this essential practice. By incorporating this best practice into your development workflow, you can proactively manage application performance and deliver a consistently high-quality user experience. This method underscores the crucial role of application performance monitoring best practices in modern software development. Popularized by industry giants like Google’s Web Performance team, Microsoft DevOps team, and GitLab, integrating performance monitoring within CI/CD pipelines has become a standard practice for achieving and maintaining optimal application performance.
Top 8 APM Best Practices Comparison
| Best Practice | Implementation Complexity 🔄 | Resource Requirements ⚡ | Expected Outcomes 📊 | Ideal Use Cases 💡 | Key Advantages ⭐ |
|---|---|---|---|---|---|
| Establish Comprehensive Service Level Objectives (SLOs) | High - requires planning and stakeholder alignment | Moderate - monitoring and analytics tools | Clear performance expectations; data-driven decisions; prioritization based on business impact | Organizations aiming for business-aligned performance targets | Aligns tech and business goals; focuses on meaningful metrics |
| Implement Distributed Tracing | High - requires instrumentation across services and tech | High - storage and processing for traces | End-to-end visibility; root cause analysis; service dependency mapping | Complex microservices environments | Complete system visibility; identifies bottlenecks |
| Monitor Real User Experience (RUM) | Medium - requires JavaScript instrumentation | Moderate - data collection and processing | Real user behavior insights; segment-specific issue detection | Web and mobile apps focused on user experience | Authentic user data; correlates UX with business metrics |
| Set Up Proactive Alerting and Incident Response | Medium-High - complex threshold configuration | Moderate to High - alerting and incident tools | Faster detection and resolution; reduced alert fatigue | Fast-paced environments needing rapid issue mitigation | Early detection; automated incident response |
| Optimize Database Performance Monitoring | Medium - requires DB expertise and tailored tools | Moderate - DB monitoring tools and analysis | Identifies DB bottlenecks; proactive optimization | DB-heavy applications | Focuses on critical app bottlenecks; capacity planning |
| Implement Infrastructure and Resource Monitoring | Medium - diverse infrastructure and tool integration | Moderate - infrastructure monitoring tools | Foundational performance insights; proactive scaling | Cloud and containerized environments | Cost optimization; infrastructure health visibility |
| Establish Performance Baselines and Trending | Medium - long-term data collection and analysis | Moderate to High - storage and analytic systems | Detects gradual degradation; capacity planning; impact analysis | Mature systems tracking performance over time | Contextualizes performance; helps spot regressions |
| Integrate Performance Monitoring into CI/CD Pipeline | High - requires setup and integration in pipelines | Moderate - testing and monitoring tools | Prevents regressions; rapid feedback; performance gates | DevOps teams wanting shift-left performance testing | Embeds performance in dev cycle; automates rollback |
Taking Your App Performance to the Next Level
Implementing the application performance monitoring best practices outlined in this article—from establishing comprehensive Service Level Objectives (SLOs) and leveraging distributed tracing to integrating performance monitoring into your CI/CD pipeline—is crucial for achieving optimal application performance. By proactively addressing performance bottlenecks through real user monitoring (RUM), database performance optimization, and robust alerting, you not only enhance user experience but also protect your organization from potential revenue loss and reputational damage. Mastering these application performance monitoring best practices empowers you to deliver high-performing, reliable applications that meet and exceed user expectations, ultimately driving business success.
Remember that consistent monitoring, analysis, and optimization are ongoing processes. As your application evolves and user behavior changes, regularly revisit your application performance monitoring strategy and adjust your approach accordingly. Proactive performance management ensures your application remains a valuable asset for your users and your business.
Want to further elevate your React Native application performance and streamline your development workflow? Explore CodePushGo to discover how its rapid update deployment capabilities can minimize downtime and seamlessly integrate with your application performance monitoring strategy, ensuring a consistently smooth user experience.