In a crowded market, a slow, buggy mobile app is a surefire way to lose users. Lagging load times, high battery drain, and frequent crashes directly impact your app’s ratings and user retention. To prevent this, development and QA teams rely on robust mobile app performance testing tools. These platforms provide the deep, actionable insights needed to diagnose bottlenecks, optimize resource usage, and ultimately deliver a five-star user experience.
This guide is designed to help you navigate the complex landscape of performance monitoring. We will explore the top 12 tools available today, breaking down their specific strengths and ideal use cases. Whether you’re a DevOps engineer managing release pipelines, a React Native developer debugging cross-platform issues, or a product manager needing real-time user insights, this resource will help you find the right solution.
Each entry includes a detailed analysis of key features, potential limitations, and pricing considerations to simplify your decision-making process. We provide direct links and screenshots for every tool, allowing you to quickly evaluate the best options for your workflow. By understanding these platforms, you can proactively identify and resolve performance issues before they affect your end-users, ensuring your application remains fast, responsive, and reliable.
1. Firebase Performance Monitoring (Google)
Firebase Performance Monitoring is a powerful, SDK-based tool from Google that offers real-time insights directly from user devices. It excels at tracking key metrics like app startup time, screen rendering performance, and network request latency for both iOS and Android applications. Its primary advantage lies in its seamless integration within the broader Google ecosystem, including Firebase and Google Cloud, making it an excellent choice for teams already invested in these platforms.
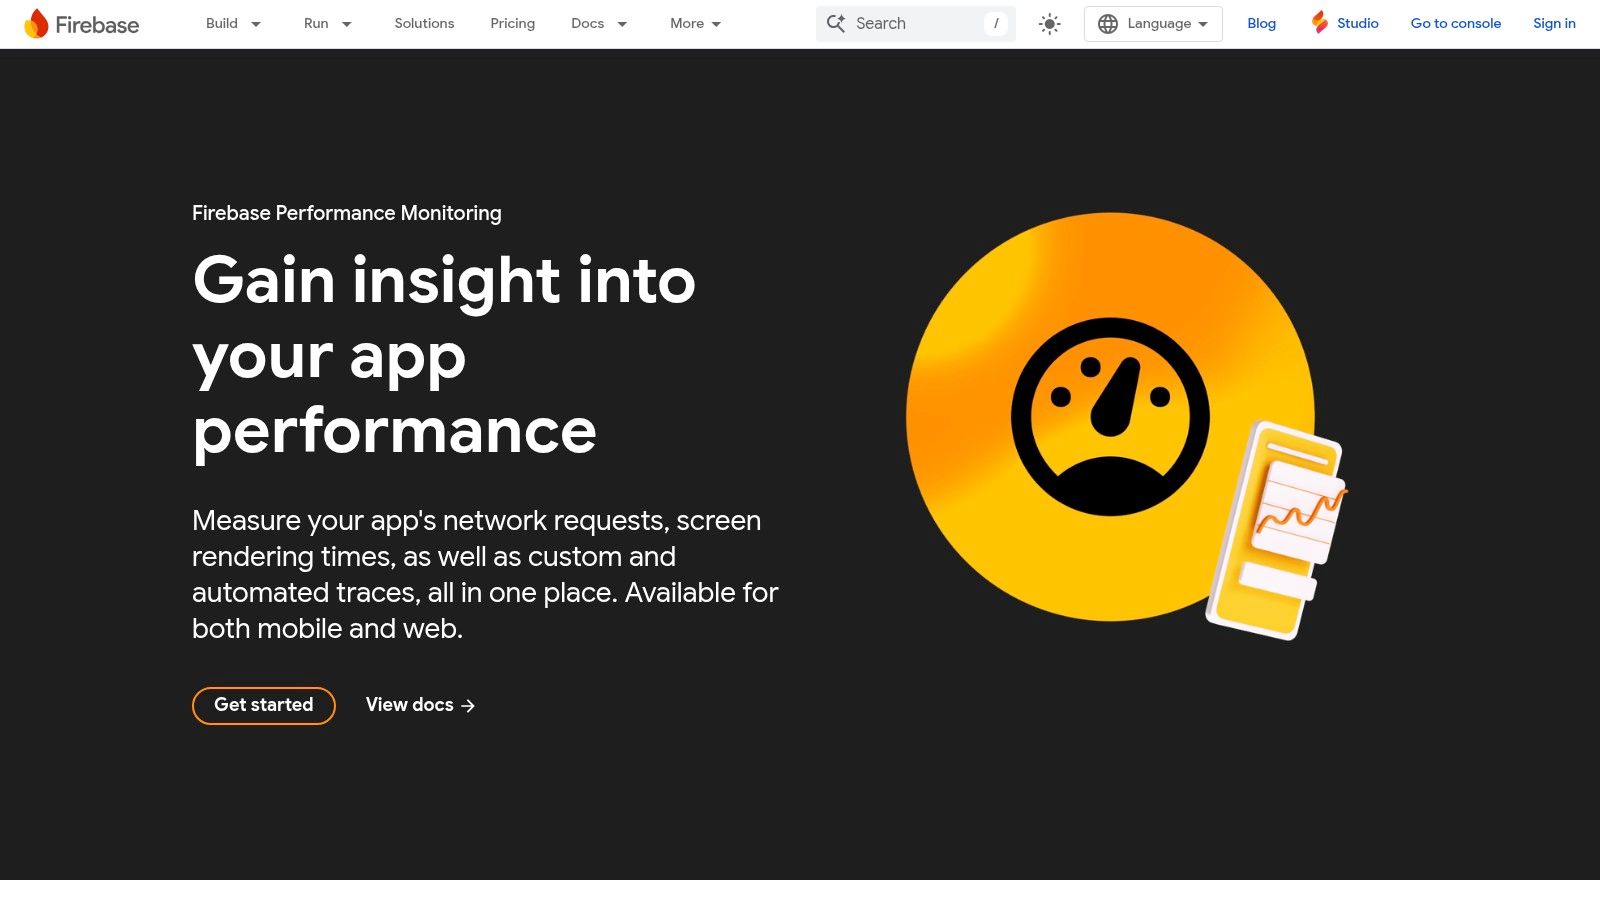
The platform automatically captures critical performance traces with minimal setup, providing immediate value. Developers can also define custom traces to measure the performance of specific code blocks, gaining granular control over their monitoring. For DevOps and QA teams, the real-time console and configurable alerts for performance regressions are invaluable for quickly identifying and addressing issues before they impact a wider user base. To get started quickly, you can learn more about its setup and benefits.
Key Features & Considerations
| Feature | Description | Best For |
|---|---|---|
| Automatic Traces | Out-of-the-box monitoring for app startup, screen rendering, and network requests. | Teams needing quick, actionable insights with minimal configuration. |
| Custom Traces | Instrument specific code segments to measure the duration of custom tasks. | Developers pinpointing performance bottlenecks in critical app functions. |
| Real-time Console | Filter performance data by app version, country, device, and OS to isolate issues. | Product managers and QA teams analyzing user-specific problems. |
| Pricing | A generous free tier is available, with paid plans based on data volume. | Startups and small teams can begin without initial investment. |
Website: https://firebase.google.com/products/performance
2. Android Studio Profiler (Google)
For developers working exclusively within the Android ecosystem, the Android Studio Profiler is an indispensable, first-party tool. Integrated directly into the Android Studio IDE, it provides a suite of profilers for real-time analysis of CPU, memory, network, and energy usage. Its primary strength lies in its deep, code-level diagnostics, allowing developers to inspect method traces, memory allocations, and network payloads with granular detail on both real devices and emulators.
The platform enables developers to record, import, and compare profiling sessions, making it one of the most effective mobile app performance testing tools for tracking down complex regressions between code changes. Unlike SDK-based tools, it offers a direct view of how the app interacts with system resources without adding overhead to production builds. For teams looking to integrate performance analysis directly into their development workflow, you can explore ways to automate Android testing to complement these profiling efforts.
Key Features & Considerations
| Feature | Description | Best For |
|---|---|---|
| Unified Profilers | A single interface to inspect CPU, memory, network, and energy usage in real-time. | Developers needing a holistic view of an app’s resource consumption. |
| Method Trace Recording | Record and visualize function calls to identify and optimize slow code paths. | Engineers performing deep code-level performance debugging. |
| Memory Profiler | Inspect memory allocations, detect memory leaks, and analyze object retention. | QA teams and developers focused on app stability and responsiveness. |
| Pricing | Completely free and bundled with the standard Android Studio IDE. | Any Android development team, from individual developers to large enterprises. |
Website: https://developer.android.com/studio/profile
3. Xcode Instruments (Apple)
Xcode Instruments is a powerful performance analysis and testing suite deeply integrated into Apple’s native development environment. Bundled free with Xcode, it provides an unparalleled level of detail for profiling applications on iOS, macOS, watchOS, and tvOS. The tool excels at offering a timeline-based view of an app’s behavior, allowing developers to correlate metrics like CPU usage, memory allocation, energy consumption, and network activity with specific user actions or code execution paths.
Its primary strength lies in its direct access to system-level data, which is essential for identifying complex issues such as memory leaks, inefficient graphics rendering, and thread-related deadlocks. For developers focused exclusively on the Apple ecosystem, Instruments is an indispensable part of the mobile app performance testing toolset. It enables precise, low-level debugging that is often difficult to achieve with third-party, SDK-based solutions, making it a critical resource for optimizing native app performance.
Key Features & Considerations
| Feature | Description | Best For |
|---|---|---|
| Correlated Timeline View | Visually correlates multiple performance metrics (CPU, memory, etc.) on a single timeline. | Developers diagnosing complex issues where multiple system resources are involved. |
| Deep System Integration | Provides direct access to low-level system and hardware performance data. | Engineers debugging memory leaks, thread contention, and energy impact. |
| Custom Instruments | Allows developers to create custom DTrace-based instruments to track specific app events. | Advanced users who need to monitor unique, application-specific behaviors. |
| Pricing | Completely free and included as part of the standard Xcode installation. | Any developer building for Apple platforms, from indie hobbyists to large enterprises. |
4. New Relic Mobile Monitoring
New Relic offers a comprehensive, all-in-one mobile monitoring and application performance management (APM) solution. It provides deep visibility into app performance, crash analytics, and user journey insights. The platform stands out by enabling end-to-end tracing that connects mobile app interactions directly to backend services, making it one of the most powerful mobile app performance testing tools for identifying root causes across the entire stack. This is particularly valuable for teams managing complex, distributed systems.
The platform supports native iOS and Android, as well as popular hybrid frameworks like React Native and Flutter, via an SDK integration. For engineering and DevOps teams, the ability to correlate a poor mobile experience with a specific backend API call is a significant advantage. It helps bridge the gap between frontend and backend teams, fostering a more holistic approach to performance management. To get the most out of it, teams can explore application performance monitoring best practices.
Key Features & Considerations
| Feature | Description | Best For |
|---|---|---|
| End-to-End Tracing | Connect mobile app performance data directly to backend services and infrastructure metrics. | DevOps teams diagnosing issues that span both client-side and server-side code. |
| Crash & Error Analytics | Provides detailed crash reports with user journey context to understand events leading to a crash. | QA teams and developers looking to reproduce and resolve critical stability issues quickly. |
| Hybrid Framework Support | Offers dedicated SDKs and support for cross-platform frameworks like React Native and Flutter. | Development teams building and maintaining hybrid applications on a single codebase. |
| Pricing | A free tier is available to get started, with paid plans scaling based on data usage and user seats. | Teams of all sizes, from startups testing the platform to large enterprises needing full observability. |
Website: https://newrelic.com/platform/mobile-monitoring
5. Datadog Mobile Real User Monitoring (Mobile RUM)
Datadog Mobile Real User Monitoring (RUM) provides a comprehensive view into the user experience of native iOS, Android, and cross-platform applications. It goes beyond standard performance metrics by connecting frontend performance data with backend traces, logs, and infrastructure metrics, offering a complete end-to-end picture. This unified approach makes it one of the most powerful mobile app performance testing tools for teams needing to troubleshoot complex, full-stack issues.
The platform shines with features like Session Replay, which allows developers and QA teams to visually reproduce user sessions to understand exactly what led to a crash or performance lag. With extensive out-of-the-box dashboards and broad framework support including React Native and Flutter, Datadog helps DevOps and product teams quickly diagnose and prioritize fixes based on real user impact. Its integration capabilities are a key differentiator, correlating mobile performance with specific API calls and server-side events.
Key Features & Considerations
| Feature | Description | Best For |
|---|---|---|
| Session Replay | Visually replay user sessions to see interactions, crashes, and UI freezes as they happened. | QA and support teams needing to reproduce and understand complex user-reported bugs. |
| Full-Stack Correlation | Connects mobile RUM data with backend traces, logs, and infrastructure metrics. | DevOps engineers troubleshooting issues that span across the entire application stack. |
| Broad Framework Support | Provides SDKs for native iOS/Android as well as cross-platform frameworks like React Native and Flutter. | Development teams working with a diverse set of mobile technologies. |
| Pricing | Flexible, usage-based pricing with separate SKUs for RUM, Session Replay, and Mobile App Testing. | Organizations that want to scale their monitoring spend based on traffic and feature usage. |
Website: https://www.datadoghq.com/product/real-user-monitoring/mobile-rum/
6. Dynatrace (Mobile Real User Monitoring)
Dynatrace is an enterprise-grade, full-stack observability platform that provides deep insights through its Mobile Real User Monitoring (RUM) capabilities. It stands out with its AI engine, Davis, which automatically detects performance anomalies, analyzes their root causes across the entire technology stack, and prioritizes issues based on user impact. This comprehensive approach connects user actions on mobile apps to backend services, infrastructure, and cloud platforms, offering unparalleled visibility.
The platform’s OneAgent technology simplifies data collection by auto-instrumenting the entire stack, significantly reducing manual configuration. For DevOps and enterprise teams, this means faster problem resolution and a holistic view of performance. Dynatrace is one of the most powerful mobile app performance testing tools for organizations that require end-to-end monitoring from the user’s tap all the way to the database query.
Key Features & Considerations
| Feature | Description | Best For |
|---|---|---|
| AI-Powered Root Cause Analysis | The Davis AI engine automatically identifies the precise source of performance issues. | Enterprise teams needing to quickly resolve complex, multi-layered problems. |
| Session Replay | Visually reproduce user sessions to understand crashes, errors, and UI freezes from the user’s perspective. | QA and support teams diagnosing specific user-reported issues. |
| Full-Stack Auto-Instrumentation | OneAgent automatically discovers and maps all components and dependencies in your environment. | Organizations seeking comprehensive observability with minimal setup effort. |
| Pricing | Based on a per-session model for RUM, with a transparent pricing calculator available online. | Large-scale applications where granular, session-based cost management is a priority. |
Website: https://www.dynatrace.com/pricing/
7. AppDynamics (Cisco) – Mobile Real User Monitoring
AppDynamics, part of the Cisco ecosystem, provides enterprise-grade mobile real user monitoring (RUM) that delivers deep visibility into the entire application delivery chain. It excels at correlating mobile app performance directly with backend server and network interactions, making it one of the most comprehensive mobile app performance testing tools for complex, distributed architectures. Its strength lies in diagnosing issues that span from a user’s device all the way to backend services.
The platform offers detailed crash reporting, network request analysis, and session data to help teams understand the complete user journey. For DevOps and enterprise IT teams, its ability to provide end-to-end transaction tracing is crucial for identifying root causes, whether they originate in the mobile code, a third-party API, or an internal microservice. This full-stack visibility sets it apart from more client-focused tools.
Key Features & Considerations
| Feature | Description | Best For |
|---|---|---|
| End-to-End Visibility | Correlates mobile app performance with backend services, network, and infrastructure health. | Enterprises needing to troubleshoot complex, multi-tier application issues. |
| Crash & Error Analytics | Provides detailed stack traces and session replays to diagnose crashes and hangs. | QA and development teams focused on improving application stability. |
| Network Request Dashboards | Monitors HTTP requests, identifies latency, and tracks errors from mobile clients. | Teams optimizing API performance and reducing network-related user friction. |
| Pricing | Enterprise-focused, quote-based pricing. Often bundled with other Cisco solutions. | Large organizations with complex procurement processes via resellers. |
Website: https://docs.appdynamics.com/appd/21.x/21.9/en/end-user-monitoring/mobile-real-user-monitoring
8. Instabug – Mobile Performance Monitoring (Enterprise)
Instabug offers a comprehensive suite for large organizations, uniquely combining Application Performance Monitoring (APM) with crash reporting, session replays, and in-app user feedback. This platform is designed for enterprise teams that need to correlate technical performance data with direct user experiences. It provides deep insights into app stability and performance, while also facilitating a direct communication channel with users for bug reporting, all within a single SDK.
The platform’s strength lies in its holistic approach, allowing developers to see not just what went wrong, but also the user context around the issue. For enterprise DevOps and QA teams, the inclusion of features like Single Sign-On (SSO) and dedicated customer success managers makes it a secure and well-supported choice. Adhering to the right strategy is key, so you can learn more about performance monitoring best practices to maximize its value.
Key Features & Considerations
| Feature | Description | Best For |
|---|---|---|
| Combined APM & Feedback | Integrates performance data with in-app bug reports and user feedback. | Teams wanting to connect technical issues directly to user-reported problems. |
| Crash & Error Reporting | Provides detailed, grouped crash reports with full stack traces and environment details. | Developers needing to quickly diagnose and resolve app stability issues. |
| Enterprise-Grade Security | Includes SSO/SCIM integration, advanced security protocols, and on-premise options. | Security-conscious organizations in regulated industries like finance or healthcare. |
| Pricing | Custom enterprise-only plans; requires direct contact with their sales team. | Large companies with specific support, security, and feature requirements. |
Website: https://docs.instabug.com/docs/enterprise-plan
9. HeadSpin
HeadSpin is a comprehensive global device cloud platform designed for in-depth mobile app performance testing and user experience analysis. It differentiates itself by providing access to thousands of real devices in over 90 locations worldwide, allowing teams to test performance under real-world network conditions. The platform goes beyond standard metrics by offering advanced AI-driven analytics for audio, video, and overall experience quality, making it a standout choice for media-heavy applications.
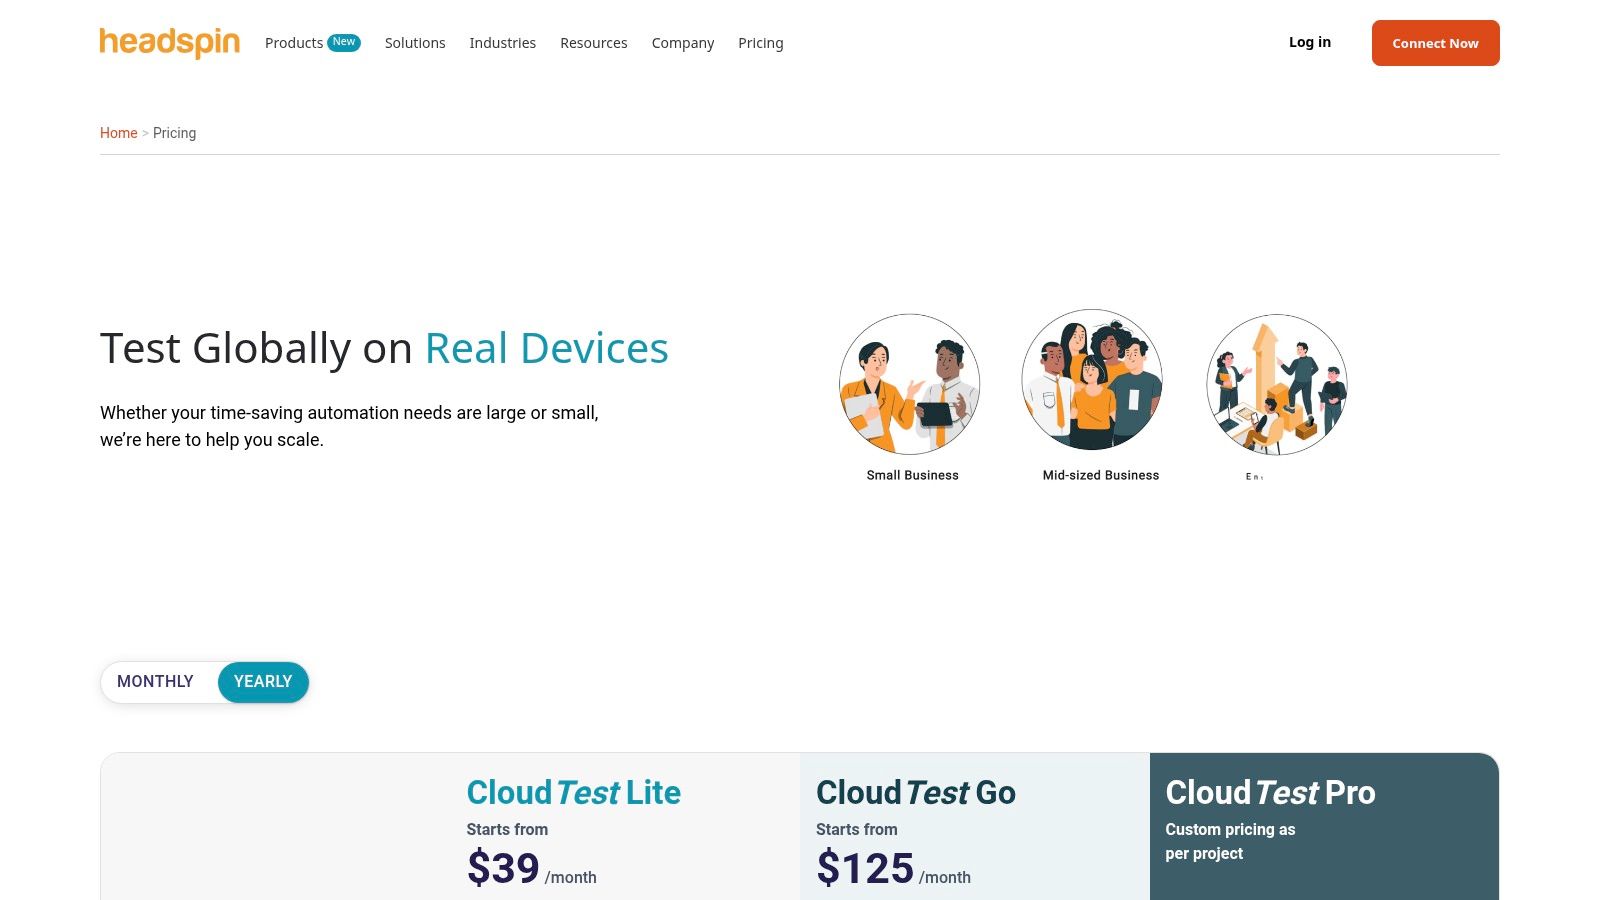
Its strength lies in providing a holistic view of performance, correlating client-side behavior with network and server-side data. For DevOps and QA teams, the seamless CI/CD integration and detailed waterfall UI help quickly identify regressions and performance bottlenecks before they reach production. The platform’s flexible deployment models, including public cloud, private cloud, or on-premise, cater to organizations with specific security and compliance requirements.
Key Features & Considerations
| Feature | Description | Best For |
|---|---|---|
| Global Device Locations | Access to real mobile devices on various carrier and WiFi networks across the globe. | Teams testing apps for an international user base or validating geo-specific features. |
| Experience & Media KPIs | Advanced AI-based analysis of video/audio quality, loading times, and user experience. | Media, streaming, and gaming companies where perceived quality is a critical success factor. |
| CI/CD Integration | Supports integration with popular CI/CD tools like Jenkins, CircleCI, and Travis CI. | DevOps teams looking to automate performance testing within their development pipeline. |
| Deployment Flexibility | Offers public cloud, dedicated private cloud, and on-premise deployment options. | Enterprises with strict data privacy, security, or regulatory compliance needs. |
Website: https://www.headspin.io/pricing
10. AWS Device Farm
AWS Device Farm is a cloud-based testing service that provides access to a massive collection of real Android and iOS devices. Instead of continuous real-user monitoring, it focuses on pre-release performance validation by allowing you to run automated tests or conduct manual interactive sessions on physical hardware. This approach is ideal for identifying hardware-specific performance issues, such as CPU spikes or memory leaks, across a diverse range of device models before your app goes live.
The platform captures detailed artifacts for each test run, including logs, video recordings, and screenshots, which are crucial for debugging. QA teams and developers can analyze performance vitals collected during the tests to pinpoint regressions. For a deeper dive into integrating such tools into your workflow, you can explore some mobile app testing best practices. Its strong integration with CI/CD pipelines and popular frameworks like Appium makes it a powerful asset for automated performance checks.
Key Features & Considerations
| Feature | Description | Best For |
|---|---|---|
| Real Device Cloud | Run automated tests or manual sessions on a large, managed fleet of physical devices. | Teams needing to validate performance across a wide variety of hardware configurations. |
| Parallel Testing | Execute tests across multiple devices simultaneously to accelerate the testing cycle. | QA and DevOps teams looking to significantly reduce the time required for release validation. |
| Vital Signs Monitoring | Captures CPU usage, memory consumption, and thread count during test execution. | Developers debugging hardware-specific performance bottlenecks and memory leaks. |
| Pricing | Pay-as-you-go model based on device minutes, with an option for unmetered access. | Organizations seeking flexible, scalable pricing without long-term commitments. |
Website: https://aws.amazon.com/device-farm/
11. Apptim
Apptim is a specialized performance testing platform that captures client-side metrics on real devices without requiring an SDK. This unique, no-code approach makes it an excellent choice for QA teams and developers who need to quickly assess app performance during pre-release cycles without altering the application build. By focusing on real-device testing, it provides accurate data on CPU, memory usage, rendering times, and power consumption, generating automatic reports after each test session.
The platform stands out by offering both a desktop client (Windows/macOS) and a cloud-based solution, giving teams flexibility in their testing workflows. Its ability to compare performance across different sessions and builds helps pinpoint regressions efficiently. For DevOps, Apptim’s integration with tools like JIRA streamlines the process of reporting and tracking performance bugs, making it one of the more practical mobile app performance testing tools for agile environments.
Key Features & Considerations
| Feature | Description | Best For |
|---|---|---|
| No-SDK Data Capture | Collects performance data on real iOS and Android devices without code instrumentation. | QA teams needing rapid, non-invasive testing before a release. |
| Automatic Reports | Generates detailed, shareable reports with key metrics after each test session. | Developers and QA leads who need to communicate performance issues clearly. |
| Performance Comparisons | Allows side-by-side comparison of test sessions to identify performance regressions. | Release engineers validating performance between app versions. |
| JIRA Integration | Create JIRA tickets directly from performance reports to streamline bug tracking. | Agile teams looking to integrate performance testing into their CI/CD pipeline. |
Website: https://www.apptim.com
12. PerfDog (Tencent WeTest)
PerfDog, from Tencent’s WeTest platform, is a powerful, client-based tool for gathering deep, device-level performance metrics. It excels in providing hardware-centric data without requiring root or jailbreak access, making it a go-to for game developers and performance engineers focused on resource-intensive applications. The tool captures everything from FPS and jank to detailed CPU/GPU usage, memory, battery temperature, and network traffic, offering a comprehensive view of how an app interacts with the device hardware.
Its primary advantage is the low-overhead data collection, ensuring that the act of measuring performance doesn’t skew the results. QA and DevOps teams can connect a device via USB to a Windows or macOS client to start capturing data instantly. The platform also includes cloud dashboards for saving test data, comparing runs, and managing team tasks, positioning PerfDog as a robust solution among mobile app performance testing tools for teams that need granular hardware insights.
Key Features & Considerations
| Feature | Description | Best For |
|---|---|---|
| No-Root/Jailbreak Metrics | Collects extensive hardware data (FPS, CPU, GPU, Memory, Power) without modifying the device. | QA teams needing to test on standard, non-compromised consumer devices. |
| Low-Overhead Collection | The client-based approach ensures minimal impact on the app’s performance during testing. | Developers working on games or graphics-heavy apps where every frame matters. |
| Cloud Dashboard & Collaboration | Upload, manage, and analyze performance data in the cloud, with features for team task management. | Distributed teams needing to share and compare performance test results. |
| Pricing | Based on usage with pricing in CNY. International procurement may require additional steps. | Teams with a budget for specialized hardware performance analysis tools. |
Website: https://wetest.qq.com/products/perfdog
Mobile App Performance Testing Tools Comparison
| Tool | Core Features ✨ | User Experience ★★★★☆ | Value Proposition 💰 | Target Audience 👥 | Unique Selling Points 🏆 |
|---|---|---|---|---|---|
| Firebase Performance Monitoring | Automatic traces, network & custom metrics | Real-time dashboards, alerting | Generous free tier for small apps | Mobile & web developers | Deep Google integration ✨ |
| Android Studio Profiler | CPU, memory, graphics, energy profiling | Live profiling on devices/emulators | Free, built-in tool | Android developers | Advanced trace export & compare |
| Xcode Instruments | Multi-instrument timeline, device targeting | Detailed system-level metrics | Free with Xcode | Apple platform developers | Correlated timeline profiling |
| New Relic Mobile Monitoring | End-to-end tracing, crash analysis | User journey insights | Free tier, scales with usage | Hybrid app teams (React Native) | Backend correlation & APM |
| Datadog Mobile RUM | Session replay, error tracking, 30+ metrics | Visual session replay | Flexible pricing SKUs | Cross-platform developers | Wide language/framework support |
| Dynatrace Mobile RUM | AI-driven insights, one-agent auto-instrument | Enterprise-level automation | Premium pricing | Large enterprise teams | AI anomaly detection & root cause analysis |
| AppDynamics Mobile RUM | Network/server analytics, instrumentation | Enterprise analytics | Sales-driven pricing | Enterprise organizations | Extensive Cisco ecosystem support |
| Instabug Mobile Performance | Crash reports, in-app feedback, enterprise SSO | Combined monitoring and feedback | Enterprise-only custom pricing | Large orgs needing support | Strong security & customer success |
| HeadSpin | Real device cloud, media quality KPIs | Global device access, CI/CD integration | Add-ons can increase cost | Performance & media analysts | On-prem & private cloud options |
| AWS Device Farm | On-demand real devices, automated/manual tests | Detailed logs & video, vitals during tests | Pay-as-you-go transparent pricing | QA engineers & testers | Scalable with CI/CD & Appium |
| Apptim | No-SDK capture, auto reports, JIRA integration | Fast setup, pre-release focus | Vendor-contact pricing | Dev teams & CI/CD pipelines | SDK-free real device data capture |
| PerfDog (Tencent WeTest) | Device metrics, no-root/jailbreak required | Cloud dashboards, collaboration | CNY pricing, Tencent procurement | Game & app developers | Low-overhead, deep device-level metrics |
Choosing the Right Tool to Elevate Your App’s Performance
Navigating the landscape of mobile app performance testing tools can seem complex, but the right choice ultimately hinges on your team’s specific context. As we’ve explored, the ideal solution depends on your app’s platform, your current development stage, and your organizational priorities. The key is to select a tool that integrates seamlessly into your workflow and provides actionable, not just informational, data.
A successful performance strategy often involves a multi-layered approach rather than a single, all-encompassing tool. Early-stage development benefits immensely from the granular, code-level analysis provided by platform-native tools like Xcode Instruments and Android Studio Profiler. These are essential for debugging and optimizing before a single line of code is shipped.
Matching Tools to Your Team’s Needs
As your application matures and reaches a wider audience, your focus must shift from simulated environments to real-world user experiences. This is where Real User Monitoring (RUM) solutions become indispensable. Tools like Datadog, New Relic, and Dynatrace provide invaluable insights into how your app behaves on diverse devices, networks, and operating systems across the globe. They help you move from “it works on my machine” to “it works for our users.”
For teams that require absolute certainty across a vast device matrix or need to replicate specific environmental conditions, cloud-based device farms are the answer. Services such as HeadSpin and AWS Device Farm offer the scale and precision needed for rigorous, pre-release validation, ensuring your app is resilient under pressure. When deciding between these sophisticated platforms, it’s wise to consider community feedback and real-world sentiment. Employing techniques like social listening for developer tools can reveal how other engineering teams are leveraging these tools and uncover potential challenges not found in marketing materials.
Final Thoughts on a Proactive Performance Culture
Ultimately, treating performance as a feature, not an afterthought, is what separates good apps from great ones. The mobile app performance testing tools discussed in this article are your allies in building a proactive culture of quality. By integrating them early and often, you empower your team to catch regressions before they impact user ratings, reduce churn, and build an application that is not only functional but truly delightful to use. This commitment to performance is a direct investment in your users’ satisfaction and your app’s long-term success.
Identified a critical performance bottleneck that’s hurting your user experience? Don’t wait for the next app store review cycle to deploy a fix. With CodePushGo, you can push instant hotfixes and performance improvements directly to your users’ devices, ensuring they get the best version of your app immediately. Ship faster and smarter by trying CodePushGo today.