In the hyper-competitive mobile landscape, tracking downloads is just the tip of the iceberg. True, sustainable growth is built on a deep understanding of user behavior, engagement, and long-term value. Without a clear grasp of the right mobile app KPIs, you’re navigating blind, unable to distinguish between genuine success and misleading vanity metrics. This guide cuts through the noise, providing a detailed rundown of the most critical performance indicators that offer actionable insights into your app’s health and financial viability.
For product managers, developers, and QA teams, mastering these metrics is the first step toward transforming an application from a fleeting novelty into an indispensable tool. This listicle will provide everything you need to know about the most essential mobile app KPIs, including:
- Daily Active Users (DAU) / Monthly Active Users (MAU)
- App Retention Rate
- Session Length and Session Frequency
- Conversion Rate
- App Store Rating and Reviews
- Customer Lifetime Value (CLV/LTV)
- Churn Rate
- Cost Per Acquisition (CPA) and Return on Ad Spend (ROAS)
We’ll dive deep into what each KPI means, how to calculate it, and, most importantly, how to use it to make data-driven decisions that propel your app forward and secure its place in the market.
1. Daily Active Users (DAU) / Monthly Active Users (MAU)
Among the most fundamental mobile app KPIs, Daily Active Users (DAU) and Monthly Active Users (MAU) measure the pulse of your user base. DAU quantifies the number of unique users who open your app at least once on a given day, while MAU tracks the unique users who engage over a 30-day period. These metrics, popularized by platforms like Facebook and Google Analytics, are the bedrock of understanding app health and growth potential.
However, tracking these numbers in isolation provides limited value. The real insight comes from their relationship, which reveals your app’s “stickiness” or how compelling it is for repeat engagement. A high DAU might look good, but if your MAU is disproportionately larger, it suggests many users only check in once a month and aren’t forming a habit.
Why It’s a Critical KPI
The DAU/MAU ratio is a powerful indicator of user retention and product value. It tells you what percentage of your monthly users are engaged enough to return on a daily basis. For product managers and developers, this KPI helps answer crucial questions: Is our new feature driving daily habits? Are our engagement campaigns working? A consistently healthy ratio signals a strong product-market fit.
Key Insight: A DAU/MAU ratio above 20% is generally considered strong for most app categories, while social or communication apps often aim for 50% or higher. Tracking this percentage over time is more insightful than monitoring absolute user counts.
The following chart illustrates how DAU and MAU are compared to calculate this crucial stickiness ratio.
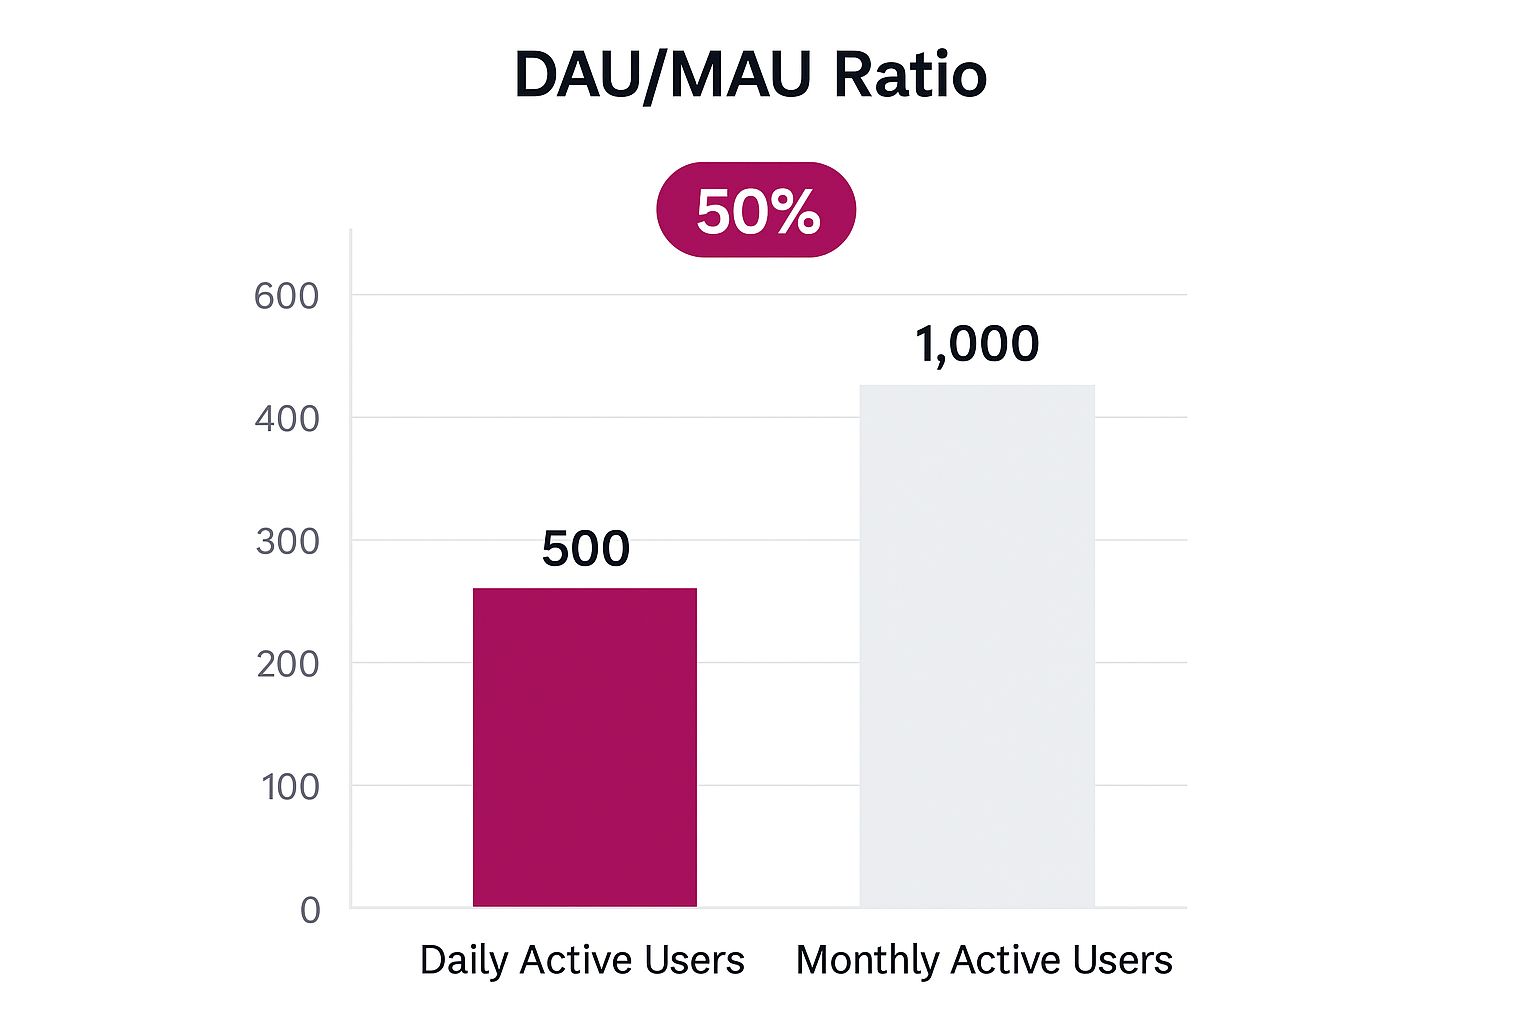 This visualization clearly shows that while the total monthly user base is large, the 25% stickiness ratio reveals that one in four monthly users returns daily, indicating a healthy level of routine engagement.
Actionable Tips for Implementation
- Segment Your Users: Don’t treat all users as one group. Analyze DAU/MAU by acquisition channel (e.g., organic search vs. paid ads) to identify which sources deliver the most engaged users.
- Track Trends, Not Dips: Daily fluctuations in DAU are normal. Focus on weekly and monthly trends to understand your app’s long-term health and the impact of feature releases or marketing campaigns.
- Combine with Other Metrics: Use DAU/MAU alongside KPIs like session length and screen flow analysis. This provides a complete picture of not just if users are returning, but what they are doing when they do.
2. App Retention Rate
While active user counts show how many people use your app, App Retention Rate reveals how many of them stick around. This crucial mobile app KPI measures the percentage of users who return to your app after their initial download over specific timeframes, typically Day 1, Day 7, and Day 30. Platforms like Amplitude and Mixpanel have championed its importance, making cohort analysis a standard for assessing long-term value and user satisfaction.
A low retention rate is a major red flag, often pointing to a flawed onboarding experience, a disconnect between your marketing promise and the actual app value, or critical user experience issues. A high churn rate, the inverse of retention, means you are constantly spending money to acquire new users just to replace the ones you are losing, which is an unsustainable growth model.

Why It’s a Critical KPI
App Retention Rate is a direct measure of your product’s stickiness and its ability to deliver lasting value. It answers the fundamental question: Do users find your app compelling enough to come back? For app developers and product managers, tracking retention cohorts provides a clear view of an app’s health over time. A strong Day 1 retention, like Duolingo’s 55% driven by gamification, is a powerful predictor of long-term success, while impressive Day 30 retention, such as the 40% seen in games like Clash of Clans, indicates a deeply embedded user habit. To delve deeper into the methodologies and impact of keeping users engaged, explore strategies for mastering customer retention metrics.
Key Insight: The first week is critical. On average, mobile apps lose about 75% of their users within the first three days. Focusing on improving Day 1 and Day 7 retention will have the largest downstream impact on your 30-day and 90-day metrics.
This metric helps teams pinpoint where users drop off in their journey, allowing for targeted improvements to the app experience. It is a core indicator of product-market fit and the potential for sustainable growth.
Actionable Tips for Implementation
- Prioritize the First Impression: Focus obsessively on Day 1 retention. A smooth, intuitive, and value-driven onboarding flow is the single most effective lever for improving all subsequent retention metrics.
- Use Strategic Re-engagement: Implement personalized push notifications to remind users of your app’s value. Instead of generic “We miss you!” messages, highlight new features, personalized content, or specific actions they can take.
- A/B Test Retention Drivers: Continuously test different features, UI elements, and engagement campaigns to identify what truly keeps users coming back. Isolate variables and measure their impact on specific retention cohorts. You can discover more advanced techniques in this guide to app retention strategies.
3. Session Length and Session Frequency
While DAU/MAU measures how many users return, Session Length and Session Frequency reveal how deeply and how often they engage. Session length tracks the average time a user spends in your app during a single, continuous visit. Session frequency measures how many times a user opens the app within a specific period, like a day or a week. These essential mobile app KPIs, championed by analytics platforms like Google Firebase and Flurry, provide a granular view of user behavior.
Together, these metrics paint a vivid picture of engagement depth and habit formation. A high session length, like the 10+ minutes often seen on TikTok, indicates compelling, immersive content that holds user attention. Conversely, a high session frequency, common for news or weather apps, suggests the app has become a go-to resource integrated into a user’s daily routine. Analyzing both helps you understand if your app is a “quick check” tool or an engrossing experience.
Why It’s a Critical KPI
Session metrics are direct indicators of your app’s value and user experience quality. A short session length combined with a low frequency might signal a critical usability problem or content that fails to hook the user. For product managers, this data is invaluable for pinpointing friction points. For instance, if users in a banking app consistently drop off after just 30 seconds, it could highlight a confusing login process or a poorly designed navigation flow.
Key Insight: The ideal session length is highly contextual. A short, efficient session of 2-3 minutes is a sign of success for a utility or banking app, as it means the user accomplished their goal quickly. For a gaming or media app, that same duration would be a red flag.
By tracking these KPIs, you can move beyond simple user counts and start optimizing for genuine engagement. An app that users open multiple times a day, even for short periods, is often more valuable and easier to monetize than an app users open once a month for a longer session. For a deeper dive into this topic, you can learn more about app engagement metrics on codepushgo.com.
Actionable Tips for Implementation
- Set Context-Aware Benchmarks: Don’t chase a universal “good” session length. Define success based on your app’s core function. Is it designed for quick tasks (high frequency, short length) or deep immersion (lower frequency, long length)?
- Segment by User Behavior: Analyze session data for different user cohorts. Do new users have shorter sessions than power users? This can reveal opportunities for improving your onboarding flow to better demonstrate your app’s value.
- Identify Abandonment Points: Use session data in conjunction with screen flow analysis to see exactly where users are dropping off. A high abandonment rate on a specific screen is a clear signal that it needs a UX overhaul.
- Optimize for Quality, Not Just Time: Focus on making each session valuable, regardless of its duration. A user who successfully completes a task in two minutes is more likely to return than one who spends ten minutes frustrated and confused.
4. Conversion Rate
Conversion Rate is one of the most direct and business-critical mobile app KPIs, measuring the percentage of users who complete a specific, valuable action. This action, or “conversion,” can range from making an in-app purchase and signing up for a subscription to completing an onboarding tutorial or sharing content. Popularized by conversion optimization platforms like Optimizely and attribution tools like Branch and AppsFlyer, this metric directly connects user behavior to business objectives.
Unlike engagement metrics that measure app usage, conversion rate quantifies how effectively your app guides users toward goals that generate revenue or deepen their investment in your ecosystem. For a deeper dive into the definitions and implications of performance indicators, refer to a glossary of key marketing metrics like CVR and LTV. Monitoring this KPI reveals the efficiency of your user journey and the persuasiveness of your value proposition.
Why It’s a Critical KPI
This KPI is essential for understanding your app’s financial viability and the effectiveness of its user funnel. A low conversion rate, despite high user traffic, signals a problem, it could be a confusing UI, a technical bug, or a weak call-to-action. By tracking conversions, product managers and marketers can pinpoint friction points and optimize the user experience to drive more valuable outcomes. Improving your conversion rate is often one of the fastest ways to boost revenue.
Key Insight: Benchmarks vary widely by industry. For instance, e-commerce apps like Shopify often see a 2-3% purchase conversion rate, while freemium models like Spotify can convert over 25% of their active user base to paid plans. The key is to establish your own baseline and continuously work to improve it.
This chart illustrates how different app types have varying conversion goals and benchmarks, from e-commerce purchases to freemium upgrades. It highlights the importance of defining what a “conversion” means for your specific business model. Tracking the right app metrics is crucial for success; you can learn more about other essential app metrics on codepushgo.com.
Actionable Tips for Implementation
- Define Micro-Conversions: Don’t just track the final sale. Map out the entire user journey and define smaller, “micro-conversions” like adding an item to a cart, starting a free trial, or completing a profile. Optimizing these smaller steps will lead to a better overall conversion rate.
- Optimize the Funnel, Step-by-Step: Use funnel analysis tools to identify where users drop off. If many users abandon their cart at the payment stage, focus your A/B testing efforts on optimizing the payment flow, pricing presentation, or trust signals.
- Leverage Personalization: Use user data and behavior to deliver personalized offers, content, and push notifications. A user who has previously browsed a specific product category is far more likely to convert on a targeted promotion for that category.
5. App Store Rating and Reviews
Often seen as a direct line to user sentiment, App Store Rating and Reviews are crucial mobile app KPIs that measure public-facing satisfaction. These metrics, prominently displayed on the Apple App Store and Google Play Store, consist of a 1-to-5-star rating and qualitative written feedback. They directly influence your app’s discoverability, conversion rate, and brand reputation, serving as social proof for potential new users.
While a high star rating is the goal, the reviews themselves contain a treasure trove of actionable data. Users provide candid feedback on everything from bugs and crashes to desired features and user interface frustrations. Monitoring these qualitative insights is just as important as tracking the quantitative star average, a practice championed by App Store Optimization (ASO) platforms and review management tools like AppFollow.
Why It’s a Critical KPI
Your app’s rating is one of the first things a prospective user sees, making it a powerful factor in their decision to download. A low rating can deter downloads and negatively impact your ranking in search results, while a high rating builds immediate trust. For product managers and developers, reviews offer invaluable, free user research. They highlight pain points and guide the product roadmap, as seen when Zoom rapidly improved its rating from 2.4 to 4.2 stars by addressing user feedback during the pandemic.
Key Insight: Responding to reviews, especially negative ones, can turn a poor experience into a positive one and even lead to a revised, higher rating. It shows prospective users that you are attentive and committed to improving your product.
Monitoring and managing these reviews is a key part of maintaining a healthy app ecosystem. It demonstrates a commitment to user satisfaction that goes beyond simple feature development.
Actionable Tips for Implementation
- Respond Promptly and Professionally: Acknowledge both positive and negative feedback. For critics, offer solutions or let them know a fix is in the works. For advocates, a simple “thank you” can strengthen loyalty.
- Time Your Rating Prompts: Use in-app rating prompts, like those offered by Apple and Google’s native APIs, but trigger them after a user has completed a positive action or achieved a goal, not during a frustrating moment.
- Analyze Reviews for Trends: Systematically categorize review feedback to identify recurring bugs, common feature requests, or widespread usability issues. Address these high-impact problems in your development sprints. For more information, you can explore the official App Store review guidelines to understand the best practices for soliciting and managing feedback.
6. Customer Lifetime Value (CLV/LTV)
Customer Lifetime Value (CLV or LTV) represents the total revenue a business can expect from a single user throughout their entire relationship with an app. It shifts the focus from short-term gains, like initial downloads or a single purchase, to long-term profitability and sustainability. This metric, championed by analytics platforms like Mixpanel and Singular, is essential for building a financially sound mobile app business.
By forecasting future revenue per user, LTV provides a critical benchmark for acquisition spending. If you know the average user will generate $10 over their lifetime, you can confidently decide how much to invest in acquiring them. This strategic insight helps prevent overspending on marketing campaigns that attract low-value users and ensures resources are allocated effectively for sustainable growth.
Why It’s a Critical KPI
LTV is the ultimate north-star metric for monetization and acquisition strategies. It directly connects user engagement and retention to financial outcomes, answering the fundamental question: Are we acquiring users who are profitable in the long run? For product managers and marketers, a rising LTV indicates that improvements in user experience, retention efforts, and monetization models are paying off. Understanding your app’s long-term viability requires a clear grasp of metrics like Customer Lifetime Value. Learn more about how to calculate Customer Lifetime Value (CLV) to master this essential KPI.
Key Insight: LTV benchmarks vary dramatically by app category. A hyper-casual game might have an LTV under $5, while a subscription-based app like Netflix can achieve an LTV over $100 annually. The key is to ensure your LTV is significantly higher than your Customer Acquisition Cost (CAC).
Actionable Tips for Implementation
- Segment Your LTV Calculations: Analyze LTV for different user cohorts based on their acquisition channel, geography, or initial in-app actions. This reveals which segments are most valuable and where to focus your marketing budget.
- Prioritize Retention to Boost LTV: The longer a user stays active, the higher their potential LTV. Focus on improving retention through better onboarding, personalized content, and proactive customer support to directly increase lifetime value.
- Use Predictive LTV Models: Don’t wait months to measure LTV. Use predictive analytics tools to estimate future value based on early user behavior (e.g., after 7 or 14 days). This allows for faster optimization of campaigns and product features.
7. Churn Rate
Churn Rate, often called user attrition, is one of the most critical mobile app KPIs for long-term viability. It measures the percentage of users who stop using your app over a specific period, essentially serving as the inverse of your retention rate. Platforms like Amplitude and Braze have popularized its tracking to pinpoint exactly when and why users abandon an app, making it a foundational metric for sustainable growth.
While acquiring new users is important, retaining existing ones is far more cost-effective. A high churn rate signals a potential disconnect between your app’s value proposition and the user experience. For example, gaming apps often see churn rates exceeding 80% within the first week, while successful subscription apps like Spotify maintain a monthly churn below 5%. This KPI forces you to look inward and address the root causes of user departure.
Why It’s a Critical KPI
Churn Rate directly impacts your Lifetime Value (LTV) and Customer Acquisition Cost (CAC) payback period. Every user who churns represents lost revenue and a wasted acquisition investment. For product managers and marketers, understanding churn is crucial for diagnosing issues. Is a confusing onboarding process causing early churn? Did a recent update introduce a bug that drove loyal users away? Tracking this metric provides the data needed to answer these questions and build a stickier product.
Key Insight: Focus on reducing churn within your most valuable user segments first. Losing a highly engaged, paying user is far more damaging than losing a casual, non-monetized one. Segmenting churn by user cohort provides a more strategic view of your app’s health.
Analyzing churn isn’t just about measuring failure; it’s about uncovering opportunities for improvement. The reasons behind user attrition provide a clear roadmap for your product development and engagement strategies.
Actionable Tips for Implementation
- Identify Early Warning Signs: Use behavioral analytics to spot indicators of potential churn, such as a sudden drop in session frequency, decreased feature usage, or ignoring push notifications. Proactively engage these at-risk users before they leave.
- Implement Win-Back Campaigns: Target recently churned users with personalized emails or push notifications offering incentives to return, like a discount or a reminder of a new feature they haven’t tried.
- Analyze Churn with Exit Surveys: When a user uninstalls or cancels a subscription, trigger a short, optional survey. Ask why they are leaving to gather direct, qualitative feedback that quantitative data alone cannot provide.
8. Cost Per Acquisition (CPA) and Return on Ad Spend (ROAS)
While engagement metrics measure user behavior inside your app, Cost Per Acquisition (CPA) and Return on Ad Spend (ROAS) evaluate the financial efficiency of getting them there. CPA calculates the total marketing cost to acquire one new user, while ROAS measures the revenue generated for every dollar spent on advertising. These KPIs, made prominent by platforms like Google Ads and Facebook Ads Manager, are the foundation of a sustainable and profitable user acquisition strategy.
Tracking these metrics independently only tells half the story. A low CPA might seem great, but if those acquired users never make a purchase, the effort is wasted. Conversely, a high ROAS is fantastic, but if the CPA is so high that it limits your ability to scale, your growth will stall. Balancing these two mobile app KPIs is key to building a profitable marketing engine.
Why It’s a Critical KPI
The relationship between CPA and ROAS is a direct measure of your marketing profitability and channel effectiveness. It helps marketing and product teams make data-driven budget decisions and optimize campaigns for maximum return. These metrics answer vital business questions: Which advertising channels are delivering the most valuable users? Are our ad creatives resonating with our target audience? A healthy balance between a manageable CPA and a strong ROAS signals an effective, scalable growth model.
Key Insight: Benchmarks vary widely by app category. Gaming apps often target a $1-5 CPA with a 200-500% ROAS, while e-commerce apps might see a $10-30 CPA but require a 300%+ ROAS to be profitable. The goal is to ensure your ROAS significantly outweighs your CPA in the long run.
Actionable Tips for Implementation
- Balance CPA with User Quality: Don’t chase the lowest CPA at all costs. Prioritize acquiring users with a high lifetime value (LTV), even if their initial acquisition cost is higher. A user who costs $5 but generates $50 is better than one who costs $1 but generates $2.
- Implement Robust Attribution: Use a mobile measurement partner like AppsFlyer or Adjust to accurately track which channels, campaigns, and creatives are driving installs and in-app revenue. This is fundamental to calculating accurate CPA and ROAS.
- Use Cohort Analysis for Long-Term ROAS: Measure ROAS not just on day one, but over 7, 30, and 90 days. A cohort analysis will reveal the true profitability of users acquired from different campaigns over time. For more complex projects, you can learn more about automation tools for DevOps to streamline your data pipelines.
Mobile App KPI Comparison Table
| Metric | Implementation Complexity 🔄 | Resource Requirements ⚡ | Expected Outcomes 📊 | Ideal Use Cases 💡 | Key Advantages ⭐ |
|---|---|---|---|---|---|
| Daily Active Users (DAU) / Monthly Active Users (MAU) | Low - basic tracking of unique users | Low - user ID tracking in analytics platform | User engagement trends, app health indicator | Apps needing engagement benchmarks and growth tracking | Easy to understand, benchmarks industry standards |
| App Retention Rate | Medium - cohort and time-based analysis | Medium - needs longitudinal data collection | Long-term user loyalty and satisfaction | Apps focused on onboarding, user satisfaction, and UX | Strong predictor of app success and UX issues |
| Session Length and Frequency | Medium - tracking session timestamps | Medium - detailed event tracking required | Depth of engagement and habit formation | Apps optimizing content, UX, and monetization strategy | Measures engagement beyond simple opens |
| Conversion Rate | Medium - defining conversion events and funnels | Medium to High - detailed event and funnel tracking | Revenue-driving user actions | Apps driving specific user actions (purchases, sign-ups) | Directly tied to revenue and ROI calculation |
| App Store Rating and Reviews | Low - monitoring publicly available data | Low - no internal tracking needed | User feedback and app discoverability | All apps relying on app store presence and trust | Impacts downloads, provides qualitative feedback |
| Customer Lifetime Value (CLV/LTV) | High - requires historical revenue & behavior data | High - data aggregation and predictive modeling | Total revenue per user over lifecycle | Apps with monetization focus and marketing budget planning | ROI framework, prioritizes high-value users |
| Churn Rate | Medium - tracking user attrition over time | Medium - requires cohort analysis | User loss insights and risk prediction | Apps aiming to reduce attrition and improve retention | Indicator for user dissatisfaction and app value |
| Cost Per Acquisition (CPA) and Return on Ad Spend (ROAS) | Medium to High - complex attribution tracking | High - marketing data and cross-channel analytics | Marketing efficiency and budget optimization | Apps with paid user acquisition and advertising budgets | Clear ROI on marketing spend, real-time optimization |
From Data to Decisions: Activating Your KPI Insights
Navigating the competitive app landscape requires more than just a great product idea; it demands a relentless focus on data-driven improvement. Throughout this guide, we’ve dissected the eight most essential mobile app KPIs that form the bedrock of a successful app strategy. From the fundamental engagement metrics of DAU/MAU and Session Length to the critical financial indicators like CLV and ROAS, each KPI tells a part of your app’s story.
Understanding these metrics individually is the first step. You now know how to calculate your Retention Rate, what constitutes a healthy Churn Rate, and why App Store Ratings are more than just vanity metrics. You have the formulas, the benchmarks, and the best practices to build a comprehensive dashboard that reflects the true health of your application. However, mastery isn’t achieved by just monitoring these numbers on a screen.
Turning Measurement into Momentum
The true value of tracking mobile app KPIs is unlocked when you translate observation into action. These metrics are not just report cards; they are roadmaps pointing directly to opportunities for growth, optimization, and enhanced user satisfaction.
- A high Churn Rate isn’t a failure; it’s a direct signal to re-evaluate your onboarding process or identify friction points in the user journey.
- A low Conversion Rate is an explicit invitation to A/B test your call-to-action buttons, simplify your checkout flow, or clarify your value proposition.
- A sudden drop in DAU should trigger an immediate investigation into recent updates, competitor moves, or marketing campaign performance.
- A declining CLV is a clear directive to focus on improving retention strategies and exploring new avenues for monetization that add value for your loyal users.
The Power of an Agile Feedback Loop
In today’s fast-paced environment, the ability to react to these KPI signals swiftly is a significant competitive advantage. Waiting weeks for traditional app store review cycles can mean losing users, revenue, and market position. This is where the synergy between robust analytics and agile deployment becomes paramount.
Imagine your team identifies a critical bug that is causing crashes and tanking your App Store Rating. Instead of waiting for a lengthy review process, you need the capability to deploy a fix instantly. This is the power of creating a tight feedback loop: Measure, Identify, Deploy, and Remeasure. By integrating your analytics with a tool that allows for over-the-air (OTA) updates, you empower your development, QA, and product teams to act on insights in minutes, not weeks. This agile approach transforms your KPIs from historical data points into a live, interactive system for continuous improvement, ensuring your app constantly evolves to meet user expectations and business goals.
Ready to close the gap between insight and action? Empower your team to respond to KPI data in real time with CodePushGo. Instantly deploy bug fixes, feature updates, and UI improvements over-the-air, turning your mobile app KPIs into a dynamic tool for growth. Get started with CodePushGo and build a more responsive, successful app today.