We’ve all been there. Staring at the screen, running on coffee, and wondering why a simple feature works flawlessly on iOS but completely breaks on Android. Or maybe you’re lost in a tangled web of state changes, desperately trying to pinpoint the one update that’s causing a chaotic re-render. These moments aren’t just frustrating; they’re genuine roadblocks that drain time and energy.
While a quick console.log can feel like a trusty old friend, relying on it alone is like trying to navigate a new city with a folded paper map. It gets the job done, but there’s a much better way. Modern debugging tools are your GPS, offering a level of insight that transforms bug hunts from a chore into a calculated process.
Shifting from reactive problem-solving to a proactive debugging mindset is what separates the pros. It’s about building stable, high-performance apps by understanding exactly what’s happening under the hood.
Your Modern React Native Debugging Toolkit
To really get a handle on your app’s behavior, you need a few core tools in your arsenal. Each serves a distinct purpose, and knowing when to reach for which one is key.
| Tool | Primary Use Case | Best For |
|---|---|---|
| Flipper | An all-in-one debugging platform | Visualizing layout, inspecting network traffic, managing device logs, and using community plugins. |
| Chrome DevTools | Direct JavaScript debugging | Setting breakpoints, stepping through code execution, and analyzing performance profiles. |
| React DevTools | Component tree inspection | Understanding component hierarchy, inspecting state and props, and profiling component renders. |
Together, these tools give you a comprehensive view of your application, from the UI layer right down to the JavaScript thread.
Moving Beyond The Console
Let’s be clear: console.log isn’t going anywhere. It’s fantastic for quick checks. But to truly understand your app, you need to go deeper.
- With Flipper, you get a powerful desktop hub with plugins for almost everything. You can inspect your Redux store, check device logs, and even see image cache performance, all in one place.
- React DevTools, which typically runs inside Flipper, is your go-to for untangling component logic. It lets you see the entire component tree and inspect the props and state of every single element.
- And when you need to get your hands dirty with the code itself, Chrome DevTools is still the champion. Setting breakpoints and stepping through functions line-by-line is invaluable for complex logic.
The real goal here isn’t just about squashing bugs as they appear. It’s about developing a deep understanding of why they happen in the first place. That’s how you start writing cleaner, more predictable, and fundamentally better code.
Before we jump into the nitty-gritty of setting these tools up, it helps to see the bigger picture. Understanding where React Native fits in the broader mobile ecosystem can really highlight why these skills are so crucial. A great Flutter vs. React Native comparison offers some fantastic perspective on this. Mastering your debugging workflow isn’t just a nice-to-have; it’s a massive professional advantage.
Configuring Your Essential Debugging Environment
Every great React Native developer knows that an efficient debugging session starts long before you find the first bug. It begins with a solid setup. Think of it as a chef prepping their station—having the right tools in place makes the whole process smoother and keeps the frustration at bay.
For many of us, the journey into JavaScript debugging started with Chrome DevTools. It’s the classic, reliable choice and often the first tool you’ll reach for. Getting it connected is simple: just open the in-app developer menu (give your physical device a shake or use the keyboard shortcut in the simulator) and hit “Debug Remote JS.”
This pops open a new Chrome tab with the familiar DevTools interface. From here, you can watch your console output, set breakpoints to freeze your code in its tracks, and meticulously step through functions to see what’s really going on. It’s an incredibly effective way to untangle complex logic and see the exact state of your variables at any point in time.
Embracing Flipper for Modern Debugging
While Chrome DevTools is a trusty workhorse, the React Native world has largely shifted towards a more powerful, integrated tool: Flipper. Backed by Meta, it has become the official, all-in-one debugging platform for good reason.
Flipper bundles a ton of functionality into a single desktop application. We’re talking a network inspector, Redux DevTools, a crash reporter, a log viewer, and React DevTools, all under one roof. Its plugin-based architecture is its real superpower, allowing you to add tools for inspecting performance, databases, and more.
To get going, download and install the Flipper desktop app. Here’s a pro tip that trips up a lot of new devs: make sure your computer and your device or simulator are on the same Wi-Fi network. Once you run your app, it should pop up automatically in Flipper.
The magic really starts when you enable a few essential plugins:
- Logs: Get a single, unified stream of native device logs from both Android and iOS. No more jumping between Logcat and Console.
- Layout Inspector: Visually inspect your component tree and tweak styles in real-time, just like you would on the web.
- Network Inspector: See every API request your app makes. You can check out headers, request bodies, and response times to hunt down network-related bugs.
This is what you’ll be looking at—a clean, centralized dashboard for all your debugging needs.
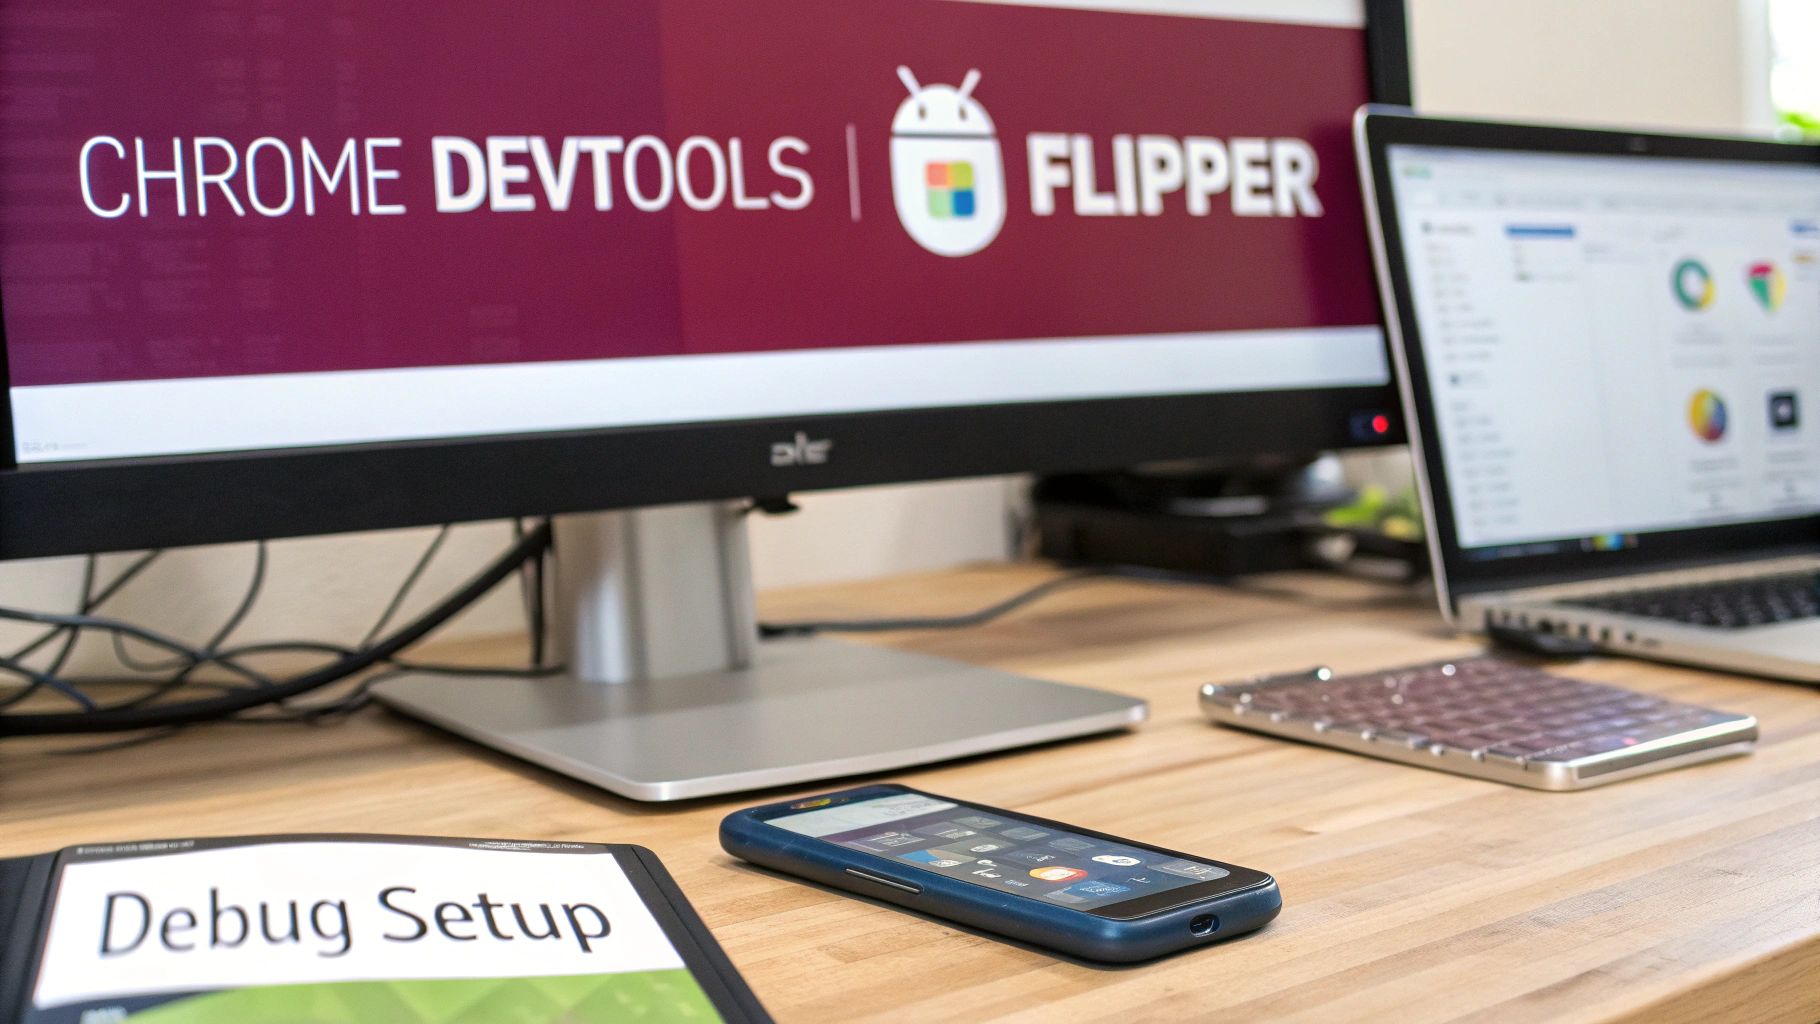
This unified view lets you effortlessly switch between checking layouts, tracking network calls, and reading logs without juggling a bunch of different windows. Of course, a huge part of debugging is knowing the tools you’re working with, which includes understanding common React Native libraries that could be causing issues in the first place.
Spending a little time upfront to set up Flipper gives you a powerful command center for virtually any debugging task. It’s an investment that pays off big time, offering insights that a simple
console.logcould never provide.
This integrated approach really is a game-changer. To see how these tools fit into the wider world of app development, check out our other posts on https://codepushgo.com/blog/category/react-native-development-tools/.
Real-World Debugging Workflows in Action
Knowing your tools is one thing, but using them to squash real, frustrating bugs is where the rubber meets the road. Let’s walk through a few classic scenarios you’ll definitely run into and see how a modern react native debug workflow can turn a nightmare into a quick fix.
The Case of the Vanishing Button
We’ve all been there. A user reports that a critical button is completely missing on their screen, but it looks perfectly fine in your simulator. Is it a styling conflict? A layout bug? Guessing is a waste of time.
This is a job for Flipper’s Layout Inspector. Instead of blindly tweaking style properties and rebuilding, you can visually inspect the live app. Just click on the empty space where the button should be and Flipper will show you the entire component tree. You might find a parent View has collapsed because of an accidental height: 0, or maybe another element is layered on top with a higher zIndex.
The real magic is that you can edit styles directly in the inspector and watch the UI update on your device in real-time. What could have been an hour of frustrating trial and error becomes a two-minute interactive fix.
Taming State Management Chaos
Here’s another headache: your app’s state is acting unpredictably. Imagine a shopping cart where items randomly disappear when a user updates the quantity. Plastering your code with console.log statements is a messy, inefficient way to track down the problem.
This is where React DevTools (and its Redux counterpart) shines. Fire it up inside Flipper and switch to the Profiler tab. Simply record the action—like updating the cart quantity—and you’ll get a detailed flame graph showing every single component that re-rendered.
This instantly helps you find performance drains. You might spot a component way down the tree re-rendering for no good reason, which a quick React.memo could fix. More importantly, the Components tab lets you step through time and inspect the props and state of your cart at any given moment, letting you pinpoint the exact action that made the item vanish.
A disciplined approach to state inspection does more than just fix bugs; it uncovers hidden performance bottlenecks. Chasing a state bug often leads you straight to an optimization that makes the whole app feel snappier.
Solving Mysterious Network Failures
Picture this: a user says their new profile picture won’t load. The app just shows a loading spinner that never goes away. Is the bug in your UI code, the API call, or is the server just failing?
Don’t start adding console.log to your API calls. Just open Flipper’s Network Inspector and follow this quick workflow:
- Trigger the action in your app by uploading the profile picture.
- Find the request in the Network Inspector’s log. Instantly, you can verify the request URL, headers, and payload to make sure your app sent the right data.
- Analyze the response from the server. This is where you find the truth. You might see a 403 Forbidden error because an auth token is missing. Or maybe you get a 500 Internal Server Error, proving the issue is on the backend.
In this scenario, you might discover the server returned a 200 OK status, but the response body contains something like {"error": "Image format not supported"}. Your app’s logic was only checking the status code, so it never caught the error. This whole investigation takes less than five minutes and gives you a concrete answer.
This kind of precise, tool-driven analysis is crucial for app stability. When issues are severe enough to cause a crash, you also need a solid reporting system. For a deeper dive on that, check out our guide on implementing mobile app crash reporting to learn how to catch production errors you can’t replicate yourself.
Optimizing Performance and Eliminating UI Lag

Nothing makes a slick, feature-packed app feel cheap faster than a laggy interface. Performance isn’t just another item on a checklist; it’s a core part of the user experience. When your app stutters or freezes, the problem almost always lies in the render cycle. This is where a sharp react native debug strategy moves beyond just fixing crashes and starts creating a genuinely smooth, responsive feel.
Your go-to weapon here is the React Native Profiler, which you’ll find inside React DevTools. The profiler lets you record interactions within your app and then spits out a “flame graph.” This visualization is pure gold—it shows you exactly which components are rendering, what triggered them, and how much time they’re eating up. It’s the most direct way to hunt down the two usual suspects behind performance issues: unnecessary re-renders and slow component mounts.
Pinpointing Unnecessary Renders
One of the most frequent performance hogs I see is components re-rendering when their props haven’t actually changed. This is a classic scenario: a parent component updates its state, triggering a waterfall of re-renders down the component tree, even for child components that didn’t receive any new information.
The fix? Memoization.
By wrapping a component in React.memo, you’re essentially telling React, “Hey, if the props haven’t changed since the last render, just skip this one.” To make this work for function props, you’ll need the useCallback hook. This ensures your functions aren’t recreated on every single render, which would otherwise invalidate React.memo’s simple comparison.
- Before Optimization: Imagine a list item component. It re-renders every single time any part of the parent list’s state changes.
- After Optimization: We wrap the item in
React.memoand its function props inuseCallback. Now, it only re-renders when its own specific data changes.
This one tweak can slash the workload on the JavaScript thread, leading to buttery-smooth scrolling in your lists and grids. For a deeper dive into these strategies, check out our other posts on React Native performance monitoring.
The New Architecture Performance Boost
For a long time, a major performance bottleneck was the old asynchronous bridge connecting the JavaScript thread to the native side. Every communication had overhead, which could add up to noticeable delays. Thankfully, React Native’s New Architecture, powered by Fabric and TurboModules, completely rewrites the rules.
By enabling direct, synchronous communication between JavaScript and native code, the New Architecture eliminates the bridge as a bottleneck. This results in a more responsive UI and a more direct debugging experience.
The difference is night and day. The new setup, including TurboModules and the Fabric Renderer, was built specifically to crush these long-standing performance headaches. We’re seeing some serious gains in the wild—benchmarks show frame rates holding strong at 60 FPS, app startup times getting slashed by up to 40%, and memory usage dropping by 20–30%. You can discover more insights about these impressive benchmarks on euroshub.com.
This shift means modern React Native apps are fundamentally faster from the get-go. As a developer, your performance debugging can now focus more on optimizing your own component logic instead of wrestling with the framework’s internal limitations.
Advanced Techniques for Complex Bugs
Sooner or later, you’ll hit a bug that just doesn’t make sense in your JavaScript code. These are the tricky ones, living somewhere in the bridge between your React Native logic and the native device APIs. When you’re stuck on these head-scratchers, it’s time to graduate from the JS debugger and dive straight into the native layer.
This means you’ll be firing up Android Studio or Xcode and attaching their powerful native debuggers directly to your running app. You can navigate into your project’s android or ios directories and open the relevant Java/Kotlin or Objective-C/Swift files. From there, you can set breakpoints right inside the native code—an absolute game-changer for figuring out what a third-party module or your own custom native code is really doing.
Tapping into Native Logs and Tools
Reading native logs is just as important as debugging the code itself. On Android, the Logcat tool gives you a massive, unfiltered stream of system messages. It’s often the only place you’ll find clues about native crashes or errors that don’t even show up in Flipper. Likewise, the Console app in Xcode is your window into iOS system logs, which is invaluable when a bug only shows up on a physical device.
For a more comprehensive view, a tool like Reactotron is fantastic. It provides a dedicated desktop app to inspect your app’s state, monitor API requests, and even dispatch actions on the fly. It’s a powerful, centralized dashboard for your debugging workflow. We cover it in more detail in our other guides on using Reactotron for debugging.
The Best of Both Worlds with DebugOptimized
For a long time, Android developers had to make a tough choice. Debug builds were easy to inspect but ran slow, while release builds were fast but a nightmare to debug. This performance gap could hide—or even create—bugs related to animations or heavy processing.
Thankfully, React Native 0.82 introduced the debugOptimized build type. Think of it as the perfect middle ground. You get performance that’s much closer to a release build, with your app running at a smooth 60 frames per second (a huge jump from the ~20 FPS of a normal debug build), all while keeping your JavaScript debugging tools fully enabled. You can now realistically test performance-heavy features without giving up your ability to set breakpoints and inspect code. You can read all about this powerful new build type at reactnative.dev.
When a bug disappears in a release build, it’s almost always a performance issue. The
debugOptimizedbuild is your best weapon for hunting down these kinds of elusive problems.
Finally, for those bugs that only happen in production, you absolutely need a crash reporting service. Tools like Sentry or Firebase Crashlytics are your best friends here. By uploading source maps during your build, these services can de-obfuscate minified production stack traces. This turns a completely cryptic error message into a readable, actionable bug report that points you to the exact line in your original source code that caused the crash.
Common Sticking Points in React Native Debugging
Even with the best tools, you’re bound to hit a few common snags when debugging a React Native app. Let’s walk through some of the questions I hear most often and tackle them with practical, real-world solutions.
How Can I See My App’s State?
One of the biggest headaches is figuring out what’s going on with your app’s state. If you’re using something like Zustand or Redux, trying to guess which action triggered a bug is a recipe for a long, frustrating day.
The answer here is almost always Flipper. Both React DevTools and Redux DevTools have fantastic plugins that plug right into the Flipper dashboard. This gives you a complete, interactive view of your state tree. You can literally rewind action history and see precisely how your state changes over time—a total game-changer.
How Do I Inspect Network Requests on a Real Device?
Debugging network requests is simple enough on a simulator, but what about a physical device? You can’t just pop open a browser inspector. This is a critical skill for figuring out why your API calls are failing or what data you’re actually getting back.
Flipper’s Network Inspector is your best friend here. Just make sure your computer and the device are on the same Wi-Fi network. Flipper will automatically pick up every single API request your app makes.
You get a clean view of everything you need:
- Request and response headers
- The full payload body
- Status codes and timing
This makes spotting a missing auth token or a 500 error from the server a piece of cake. If you want to dive deeper into these kinds of workflows, we have a whole collection of articles covering JavaScript debugging strategies that can help you level up your skills.
The toughest bugs are often the ones you only see in production. You can’t attach a standard debugger to a release build—the code is minified and optimized, making it nearly impossible to read. You need a completely different approach.
This is where crash reporting services like Sentry or Firebase Crashlytics are indispensable. When you build your app for release, you also upload source maps to these services. When a user’s app crashes in the wild, the service uses those source maps to de-obfuscate the error log. What was once a meaningless crash report becomes a readable stack trace pointing you directly to the line of code that broke.
Ready to ship fixes and updates instantly, without waiting for app store reviews? CodePushGo streamlines over-the-air updates for your React Native apps, allowing you to deploy critical patches in minutes. https://codepushgo.com