Understanding React Native Performance Fundamentals
Performance is paramount for any mobile application. Users expect a smooth, responsive experience. Lagging or stuttering can lead to frustration and app abandonment. In React Native development, understanding performance dynamics is crucial for creating a seamless user experience. This means optimizing how your app uses resources like the processor and memory, particularly during UI updates.
The JavaScript Thread and UI Responsiveness
A key concept in React Native performance is the relationship between the JavaScript thread and the UI thread. The JavaScript thread manages the application’s logic, including API calls, data processing, and UI updates. The UI thread, on the other hand, renders the user interface and handles user interactions. These two threads communicate via a bridge, which can become a performance bottleneck if not managed carefully.
This separation of threads is essential for a smooth user experience. A complex calculation on the JavaScript thread, for example, shouldn’t freeze the UI. However, if the JavaScript thread gets overloaded, it can delay UI updates and cause noticeable lag. React Native aims for a frame rate of at least 60 frames per second (fps), the industry standard for smooth mobile experiences. The JavaScript thread plays a vital role in achieving this target. For more detailed information, you can Explore React Native’s performance guidelines.
Why 60 FPS Matters
The 60 fps target translates to approximately 16.67 milliseconds to render each frame. If the JavaScript thread is blocked for longer than this, frames are dropped, and the UI becomes choppy. For example, a long-running task on the JavaScript thread, like a complex setState update triggering a heavy re-render, can cause performance problems. This highlights the importance of optimizing JavaScript execution and minimizing blocking operations.
Optimizing for Performance
Several techniques can improve performance related to these concepts. Batching updates reduces the communication between the JavaScript and UI threads across the bridge. Using efficient data structures and algorithms in your JavaScript code also helps reduce processing time and improve responsiveness.
Furthermore, consider tools like ShouldComponentUpdate or React.memo to prevent unnecessary re-renders. These techniques ensure components only update when their props or state change, minimizing work for the UI thread.
Understanding the interplay of the JavaScript thread, UI updates, and frame rate is fundamental to effective React Native performance monitoring. This foundational knowledge helps identify bottlenecks and implement optimization strategies. By focusing on these core principles, you can create smoother, more responsive user experiences, contributing to the overall success of your React Native applications.
Essential Tools For React Native Performance Monitoring
Performance monitoring is crucial for React Native applications. It’s not enough to simply build features; ensuring those features operate smoothly and efficiently is paramount. This requires utilizing the right tools to identify performance bottlenecks and optimize your app. The correct tools empower developers to proactively address issues before they impact users.
Flipper and Firebase: Industry Standards
Profiling and debugging are essential for maintaining performant React Native apps, especially in competitive markets where responsiveness directly affects user retention and, ultimately, a business’s bottom line. Tools like Flipper and Firebase Performance Monitoring have become industry standards. Flipper provides real-time performance insights, enabling developers to effectively track memory usage, CPU consumption, and UI responsiveness during development and testing. Firebase Performance Monitoring gathers performance data from real users in production, offering metrics on network latency, app startup time, and screen rendering speed. This data helps pinpoint bottlenecks that could be device-specific or network-related. Studies indicate that using such tools can improve performance by 20-30%, significantly reducing crashes and dropped frames. This real-time and post-release monitoring is critical, especially in a global market where users demand native-level performance from cross-platform apps. For a deeper dive into React Native performance, check out Netguru’s blog.
Visualizing Performance Metrics
The infographic below illustrates key React Native performance metrics visualized directly on a smartphone screen. It displays performance graphs overlaid on code snippets, with a clear “Performance Metrics” label highlighting the data. This visualization emphasizes the importance of real-time monitoring within the development process.
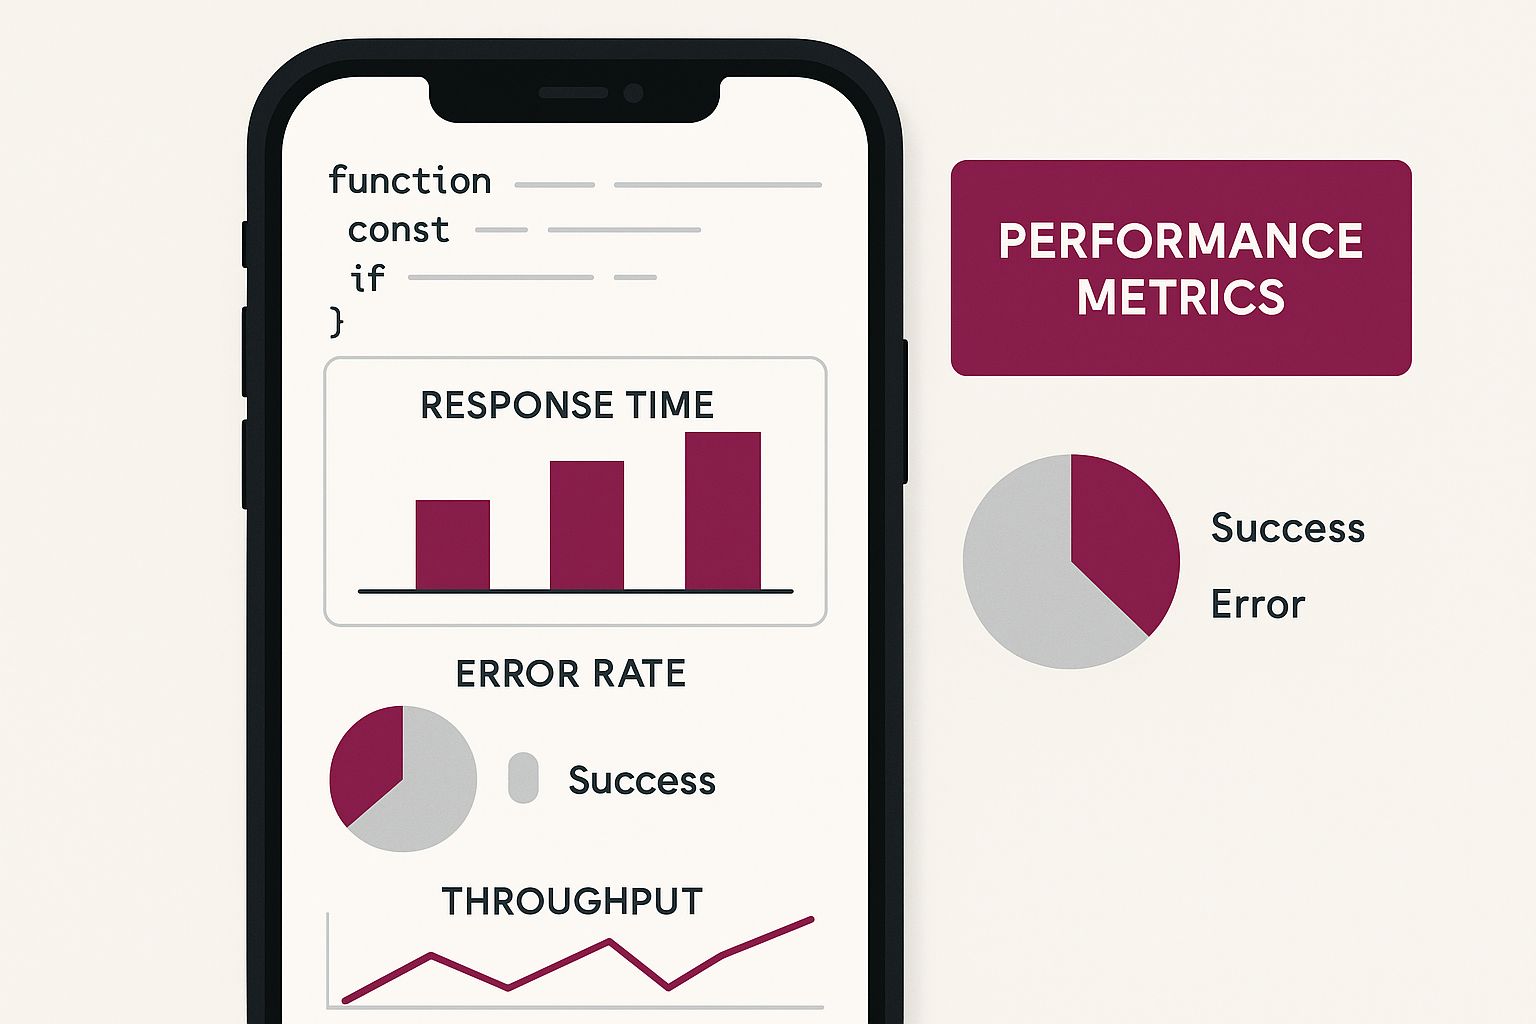
The key takeaway here is the ability to link performance visualizations with specific code sections. This direct correlation helps developers identify the precise lines of code causing bottlenecks, allowing for quick and effective optimization.
Open-Source Alternatives and Best Practices
Beyond Flipper and Firebase, the open-source community provides robust alternatives. One such example is react-native-performance-stats. This library offers detailed insights into metrics like FPS, memory consumption, and CPU usage.
To further refine your approach, the following table compares several performance monitoring tools:
Performance Monitoring Tools Comparison: This table compares features, pricing, and capabilities of popular React Native performance monitoring tools.
| Tool Name | Real-time Monitoring | Production Analytics | Cost | Best Use Case |
|---|---|---|---|---|
| Flipper | Yes | Limited | Free | Development & Testing |
| Firebase Performance Monitoring | Yes | Yes | Pay-as-you-go | Production Monitoring |
| react-native-performance-stats | Yes | Limited | Free | Development & Testing |
This table summarizes the key features of each tool, highlighting their strengths in different areas. Flipper and react-native-performance-stats are excellent free choices for development and testing, while Firebase excels in production analytics with its pay-as-you-go model.
For developers seeking more advanced application performance monitoring best practices, exploring resources like this article on application performance monitoring best practices can prove invaluable. Integrating these tools and techniques into your workflow can significantly enhance app performance and deliver a better user experience.
Advanced Monitoring With Specialized Libraries
Moving beyond basic React Native performance monitoring unlocks valuable, granular insights that can significantly improve app performance. This involves using specialized libraries that go beyond the metrics provided by standard performance monitoring tools. These advanced libraries offer a deep dive into performance, helping developers understand and optimize their code at a more fundamental level.
Unveiling Granular Insights
While standard performance monitoring tools give a broad overview, specialized libraries provide much more detailed metrics. These metrics often include UI thread FPS, JS thread FPS, memory consumption, and CPU usage. Having access to this granular data allows developers to pinpoint specific bottlenecks that negatively impact the user experience. For example, imagine you want to analyze memory allocation during a complex animation. A specialized library can reveal whether the animation is consuming excessive memory, potentially causing slowdowns or even crashes.
Implementing Advanced Monitoring Libraries
Integrating these libraries typically involves a few key steps. First, you’ll need to set up custom performance tracking, focusing on the specific metrics that are most relevant to your application. This might involve instrumenting specific functions or components to capture timing and resource usage information. Next, automated alert configuration is essential. By setting thresholds for your most important metrics, you can receive immediate notifications when performance drops below acceptable levels, allowing you to address issues proactively. Finally, integrating the monitoring data directly into your development pipeline is vital for streamlining the feedback loop. This enables developers to tackle performance concerns during the development process, well before the app is released to users.
The use of these specialized libraries is constantly increasing. The open-source library react-native-performance-stats, for instance, provides detailed real-time statistics similar to those available in the built-in React Native Perf Monitor. Its compatibility with both new and older React Native architectures ensures seamless integration. react-native-performance-stats empowers developers to log performance data and react dynamically. For example, you could temporarily pause resource-intensive processes if the FPS falls below a defined threshold. Utilizing these types of tools is considered best practice, especially in competitive app markets where performance directly impacts user satisfaction and retention. For more insights, you can also check out this resource on application performance monitoring dashboards.
Structuring Monitoring Strategies
High-performing development teams structure their monitoring strategies with long-term success in mind. They prioritize continuous monitoring across development, testing, and production environments. This ensures they have a complete picture of app performance at all stages. They establish clear performance benchmarks to track progress and quickly identify any regressions. They also cultivate a culture of proactive performance optimization, where developers are encouraged and empowered to address performance issues early in the development cycle. This proactive approach ensures that performance remains a top priority throughout the application’s lifecycle.
Implementing Real-Time Performance Tracking That Works
Real-time performance monitoring is essential for React Native development, offering immediate feedback and valuable insights into your application’s behavior. However, implementing effective real-time tracking requires careful planning and execution to avoid negatively impacting performance. This section guides you through building a robust real-time performance tracking system that operates seamlessly in both development and production environments.
Collecting Meaningful Performance Data
The first step is identifying the Key Performance Indicators (KPIs) most relevant to your app. Concentrate on metrics directly impacting the user experience, such as frame rates, component render times, and network latency. Avoid collecting excessive data that doesn’t offer actionable insights, as this can create unnecessary overhead. For further reading on related topics, check out this article on How to master React Native CI/CD.
-
Frame Rates: Monitor how consistently your app maintains the target 60 frames per second (fps). Drops in frame rate can result in a choppy and unresponsive user interface.
-
Component Render Times: Pinpoint slow-rendering components that might be causing performance bottlenecks. Optimizing these components can significantly improve overall app performance.
-
Network Latency: Measure the time it takes for network requests to complete. Slow network responses can dramatically impact user experience, especially in data-intensive applications.
For example, in an e-commerce app, monitoring product image loading times is vital for a smooth browsing experience. Focusing on specific, relevant metrics allows you to prioritize optimization efforts and improve user satisfaction.
Setting Up Automated Alerts
Automated alerts enable you to proactively address performance issues before they affect users. Configure alerts for critical KPI thresholds, such as a sustained drop in frame rate or excessive network latency. Ensure alerts are actionable and avoid overwhelming your team with unnecessary notifications.
-
Define Clear Thresholds: Set specific thresholds for your chosen KPIs based on acceptable performance levels. This ensures alerts are triggered only when performance dips below a defined standard.
-
Prioritize Alerts: Focus on alerts signaling critical issues requiring immediate attention. This helps your team efficiently address the most impactful performance problems.
-
Use a Centralized Alerting System: Aggregate alerts into a single system to streamline monitoring and management. This provides a unified view of all performance alerts, making it easier to identify and address issues.
For instance, an alert triggered by a significant increase in average network request time could indicate a server-side problem or network connectivity issues.
Building Actionable Dashboards
Effective dashboards visualize your performance data clearly and concisely, enabling informed decision-making. These dashboards should display key trends and highlight areas needing optimization.
-
Visualize Key Metrics: Use charts and graphs to visualize key performance data over time. Visual representations make it easier to identify trends and patterns in your performance data.
-
Customize Dashboard Views: Tailor dashboards to specific team needs, providing quick access to relevant information. This allows different teams to focus on the metrics most important to their roles.
-
Integrate with Development Tools: Connect your dashboards to your development tools for seamless monitoring and debugging. This integration allows you to quickly identify and resolve performance issues within your development workflow.
With the right dashboard, you can quickly identify long-running network requests or inefficiently rendering components. Correlating performance data with user behavior and business metrics allows you to understand how performance impacts user engagement and, ultimately, your bottom line. Implementing these practices strategically creates a robust real-time monitoring system that facilitates data-driven optimizations and contributes to the success of your React Native applications.
Turning Performance Data Into Real Improvements
Collecting performance data is only the first step. The true value lies in understanding how to interpret that data and use it to make tangible improvements to your React Native application. This section bridges the gap between monitoring and optimization, guiding you through the process of turning raw metrics into a smoother, more responsive user experience. You might be interested in: How to master performance monitoring best practices.
Identifying High-Impact Optimization Opportunities
The initial step involves identifying the areas where optimization efforts will yield the greatest return. This requires analyzing your performance data and pinpointing the bottlenecks impacting key user flows. For example, if your data reveals slow startup times, focusing on optimizing the initial render process will significantly improve user perception.
Similarly, if your app suffers from choppy animations, examining UI thread performance becomes a priority.
-
Prioritize User-Facing Metrics: Focus on metrics that directly correlate with user experience, such as frame rates, load times, and interaction responsiveness.
-
Analyze User Flows: Identify the critical paths users take within your app and prioritize optimizing those flows.
-
Use Profiling Tools: Employ tools like Flipper and Firebase Performance Monitoring to pinpoint specific performance bottlenecks within your code.
Prioritizing Fixes Based on User Impact
Not all performance issues are created equal. Some might have a minor impact on the overall user experience, while others can be major deterrents. Prioritizing fixes based on their impact allows you to address the most critical problems first. This requires considering both the severity of the issue and the number of users affected. A minor performance glitch affecting a large portion of your user base might be a higher priority than a major issue affecting only a small segment.
Creating a performance impact matrix, like the one below, can help with this prioritization process. This matrix allows you to weigh the potential performance gains against the difficulty of implementation and the required time investment.
To help visualize and prioritize these optimization efforts, the following table provides a framework for making informed decisions.
Performance Optimization Impact Matrix
Prioritize optimization efforts based on implementation difficulty versus performance impact.
| Optimization Type | Implementation Difficulty | Performance Impact | Time Investment | User Benefit |
|---|---|---|---|---|
| Image Optimization | Low | High | Low | Faster Loading Times |
| Lazy Loading | Medium | High | Medium | Improved Initial Load Time |
| Code Splitting | Medium | High | Medium | Reduced Bundle Size |
| Memory Leak Fixes | High | High | High | Improved Stability |
As shown in the table, image optimization offers a high impact for relatively low effort, making it a good starting point. Conversely, memory leak fixes, while crucial, require a higher investment of time and resources.
Measuring the Real Effectiveness of Your Improvements
After implementing performance optimizations, it’s crucial to measure their real-world effectiveness. This involves comparing before-and-after metrics to quantify the impact of your changes. For example, if you optimized image loading, track the change in average image load times.
This data-driven approach provides concrete evidence of the success of your optimization efforts and informs future optimization strategies. Additionally, consider A/B testing different optimization approaches to determine which yields the best results for your specific use case.
-
Establish Baseline Metrics: Before implementing any changes, gather baseline performance data to serve as a benchmark for comparison.
-
Track Key Metrics: Monitor the relevant performance metrics after implementing optimizations to quantify their impact.
-
Iterate and Refine: Based on the measured results, iterate on your optimizations to further improve performance.
By following this systematic approach, you can transform raw performance data into meaningful improvements that enhance user satisfaction and contribute to the overall success of your React Native application. Remember, continuous monitoring and optimization are essential for maintaining a high-performing app over time.
Building A Performance-First Development Culture
Sustainable React Native performance relies on more than just tools and techniques. It requires a development culture that prioritizes performance from the outset. This means integrating performance monitoring into every stage of your workflow, fostering a sense of shared responsibility for performance, and continually refining your approach as your team and application grow.
Integrating Performance Monitoring Into Daily Workflows
High-performing teams don’t treat performance as an afterthought. They integrate it into their daily routines. This includes regular activities such as:
-
Code Reviews: During code reviews, team members should specifically look for potential performance bottlenecks. This might involve identifying computationally intensive operations, inefficient rendering patterns, or excessive memory allocation.
-
Testing: Integrate performance testing into your regular testing cycles. Consider automated tests that measure key metrics like startup time, frame rates, and memory usage.
-
Deployment Processes: Before deploying new code, establish performance benchmarks and ensure the new code meets those standards. This helps prevent performance regressions from impacting your users.
For example, during a code review, a team member might notice a component re-rendering unnecessarily. Addressing this during the review prevents a performance issue from reaching production. This proactive approach can significantly reduce performance-related bugs and improve overall app quality.
Establishing Meaningful Performance Benchmarks
Meaningful performance benchmarks are essential for tracking progress and identifying regressions. Consider these key characteristics:
-
Specific: Define precise metrics to track, such as startup time, frame rate, and memory usage. Avoid vague benchmarks.
-
Measurable: Use tools to quantify your performance metrics and track changes over time. This allows you to objectively assess the impact of optimization efforts.
-
Achievable: Set realistic benchmarks that are challenging yet attainable. This keeps the team motivated and focused on continuous improvement.
-
Relevant: Choose metrics relevant to your application and user needs. For example, video playback smoothness is a key benchmark for a video streaming app.
Creating Accountability Systems
Accountability is essential for maintaining performance as a top priority. Several methods can help achieve this:
-
Ownership: Assign clear ownership for different performance aspects of the application. This ensures someone is responsible for monitoring and addressing issues.
-
Performance Budgets: Define performance budgets for key metrics. This provides a clear target and helps prevent performance creep.
-
Regular Reporting: Regularly report on performance metrics and progress towards goals. This keeps the team informed and focused on improvement.
Also, consider implementing performance alerts to notify the team when critical metrics fall outside acceptable ranges. You might be interested in: How to master user experience.
Maintaining Performance Standards As You Scale
As your team and application grow, maintaining performance standards becomes more challenging. A proactive approach is necessary:
-
Scalability Testing: Regularly test your app’s performance under increasing load. This identifies potential bottlenecks early.
-
Continuous Monitoring: Continuously monitor performance metrics in production to detect and address any emerging issues. This allows you to respond quickly to regressions and minimize user impact.
-
Performance-Focused Training: Invest in training to improve your team’s performance awareness and optimization skills. This ensures everyone understands performance’s importance and how to contribute to improving it.
By fostering a performance-first development culture, you can ensure performance remains a top priority. This leads to a smoother user experience and contributes to your React Native application’s success.
Start optimizing your React Native app updates with CodePushGo, a platform designed for streamlined and secure over-the-air updates. Learn more about CodePushGo and how it can help improve your React Native app’s performance.