To really get a handle on debugging in React Native, the first thing you need is a solid environment that connects your app to the right tools. It all starts with the developer menu, which is your gateway to powerful helpers like Flipper and Chrome DevTools. Think of this setup as your command center for tackling everything from simple logic errors to those tricky native UI glitches.
Building A Rock-Solid Debugging Environment
Before you can even think about squashing bugs, you need to sharpen your tools. A well-configured debugging setup is what separates a frustrating day of guesswork from a methodical, productive one. You’re building a stable foundation so that when an error pops up—and it will—you’re fighting the bug, not your own setup.
Your first move in any React Native debugging session is to open the in-app developer menu. This little menu is your portal to all the good stuff.
- On an iOS Simulator: Just hit
Cmd + Don your keyboard. - On an Android Emulator: The shortcut is
Cmd + Mfor macOS orCtrl + Mif you’re on Windows or Linux. - On a physical device: Give it a little shake.
From this menu, you can toggle crucial features like “Debug” (which hooks you into Chrome DevTools), “Show Element Inspector,” and “Show Perf Monitor.” Getting comfortable with this simple action is the first real step toward mastering your app’s behavior.
Connecting To The Metro Bundler
The Metro Bundler is the JavaScript bundler for React Native, and it’s at the heart of your entire development workflow. It’s what takes all your code, bundles it up, and serves it to your app. A stable connection to Metro is absolutely non-negotiable for a smooth debugging experience.
If you ever see your app fail to load or flash a dreaded red screen on startup, the very first place you should look is the terminal window where Metro is running. This log gives you a live feed of bundling progress, syntax errors, and any issues with module resolution. More often than not, a quick glance at the Metro output will show you the root cause of a startup problem before you even have to touch a debugger.
Why Flipper Is Your New Best Friend
While Chrome DevTools is a classic for JavaScript, Flipper has really taken over as the official, all-in-one debugging platform for React Native. As the ecosystem has grown—powering over 11 million websites and major apps like Netflix—the need for better tools has become critical. Flipper, maintained by Meta, is a game-changer because it gives you deep insights into both the JavaScript and the native layers of your app. We’re talking network inspection, Redux DevTools, crash reporting, and so much more, all in one place.
Flipper is a desktop app that automatically discovers your running React Native app and provides a whole suite of powerful plugins right out of the box.
This infographic gives a great high-level view of the trade-offs between using the built-in debuggers versus more advanced external tools like Flipper.
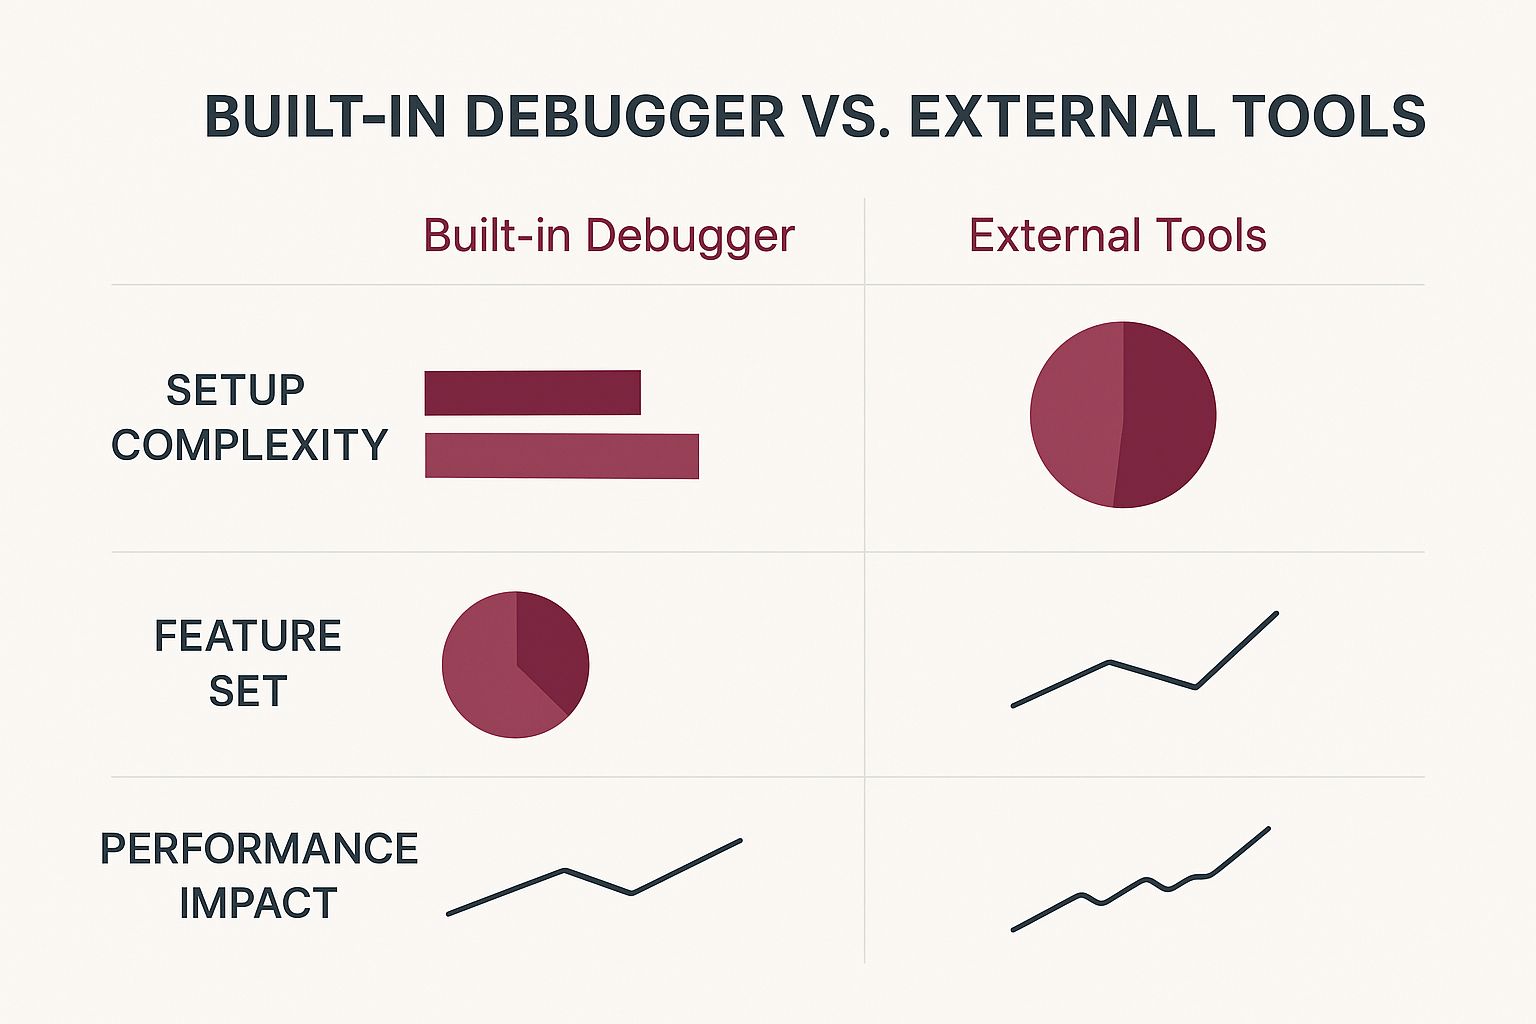
As you can see, the built-in tools are great for quick, simple tasks. But when you need to dig deeper, an external platform gives you a much richer feature set, even if it takes a bit more effort to set up. A solid environment is a foundational part of the entire development process, which you can learn more about by checking out our guide on building apps with React Native.
Your React Native Debugging Toolkit
Here’s a quick look at the primary debugging tools, their core strengths, and what they’re best used for. Use this to pick the right tool for any problem you face.
| Tool | Primary Use Case | Key Features | Best For |
|---|---|---|---|
| Chrome DevTools | JavaScript debugging and performance profiling. | Console logging, breakpoints, source mapping, performance timeline. | Inspecting JS logic, setting breakpoints in your code, and analyzing component re-renders. |
| React DevTools | Inspecting the React component hierarchy. | Component tree view, state and prop inspection, profiler. | Understanding your component structure and figuring out why a component isn’t rendering as expected. |
| Flipper | All-in-one platform for JS and native debugging. | Network inspector, crash reporter, device logs, layout inspector, Redux debugger. | A comprehensive view of your app, including native modules, network requests, and device-specific issues. |
| Logcat (Android) | Viewing native Android logs. | System-level messages, log filtering by tag and level. | Debugging native crashes or issues specific to the Android platform that don’t appear in Metro. |
| Console (iOS) | Viewing native iOS/macOS logs. | Real-time log streaming, advanced filtering. | Tracking down native iOS-specific bugs or performance problems on a physical device or simulator. |
Choosing the right tool is all about context. For a quick logic check, Chrome DevTools might be enough. But for a deep dive into a tricky bug involving both native and JS code, Flipper is probably your best bet.
Mastering Chrome DevTools for JavaScript Logic

While console.log is a trusty friend for quick checks, relying on it exclusively is like trying to build a house with only a hammer. To truly debug React Native apps effectively, you need to get comfortable with the full power of Chrome DevTools. Think of it as the command center for everything happening inside your app’s JavaScript thread.
When you connect your app to the debugger, Chrome DevTools opens a direct window into its execution. This is the moment you stop guessing what your code is doing and start knowing what it’s doing, line by line.
Beyond The Console Log With Breakpoints
The real game-changer is breakpoints. A breakpoint is simply a marker you place in your code that tells the JavaScript engine to hit the brakes and pause execution right at that spot. Instead of just seeing a variable’s value at one point in time, you get to freeze the entire application state, letting you explore everything at your leisure.
Getting one set up is easy. Head over to the Sources tab in Chrome DevTools. You can find the file you want to inspect by using the Cmd+P or Ctrl+P shortcut, which is a huge time-saver. Once you’re in the right file, just click on a line number. A blue marker will appear, and the next time that code runs, your app will pause.
Pro Tip: Don’t stop at simple breakpoints. If you right-click on a line number, you can set a conditional breakpoint. This lets you specify an expression, like
items.length === 0, and the debugger will only pause when that condition is true. It’s an amazing tool for avoiding the tedious task of stepping through countless loop iterations.
Once the code is paused, the real investigation begins. The panel on the right side becomes your best friend, giving you a complete overview of what’s happening.
- Watch: Manually add variables you want to keep a close eye on as you step through the code.
- Call Stack: This shows you the function-call-chain that led you to this exact point. It’s invaluable for tracing how your app got into a weird state.
- Scope: Here, you can inspect every variable available in the current scope—local, closure, and global.
This level of detail turns debugging from a black box guessing game into a transparent, straightforward process.
Analyzing Network Requests
Is your app failing to load data? Did you send the wrong payload to your API? For these kinds of problems, the Network tab in Chrome DevTools is indispensable. Every single HTTP request your app makes shows up here in real-time.
Click on any request to get a full breakdown. You can inspect:
- Headers: Perfect for checking auth tokens, content types, and other metadata.
- Payload: Verify the exact data your app is sending in a POST or PUT request.
- Response: See the raw JSON from the server before your app even touches it.
- Timing: Analyze how long each part of the request cycle took, from the initial connection to the final download.
More often than you’d think, a bug isn’t in your React Native logic but in the data you’re sending or receiving. A quick glance at the Network tab can save you hours of chasing ghosts in your code. For a deeper dive, our collection of articles on JavaScript debugging offers even more strategies.
Visualizing Components With React DevTools
Although it’s a separate extension, React DevTools plugs right into your Chrome DevTools setup, adding two incredibly useful tabs: Components and Profiler. The Components tab is your go-to for anything UI-related.
It presents a tree view of your entire component hierarchy, much like the Elements tab does for HTML. When you select a component from this tree, you can:
- Inspect and edit its props and state: Tweak values on the fly and see how your component reacts instantly, all without a full app reload.
- Find the rendering component: Use the “eye” icon to immediately highlight where that component is on your app’s screen.
- Trace component updates: The Profiler is your tool for hunting down performance bottlenecks by showing you exactly why a component re-rendered.
By combining breakpoints for logic, network inspection for data, and React DevTools for the UI, you turn Chrome DevTools into a complete diagnostic suite. This integrated approach is the key to efficiently finding and squashing even the most complex bugs.
Using Flipper for Deep Native and UI Inspection
Sometimes your JavaScript looks perfectly fine, but the app just isn’t behaving. When you hit that wall, it’s a clear sign the problem is buried deeper, in the native layer. This is exactly where Flipper, Meta’s powerhouse mobile app debugger, comes into play and becomes one of your most essential tools.
Flipper is a desktop app that bridges the gap between your JS code and the native iOS and Android environments. It offers a level of visibility that standard tools like Chrome DevTools just can’t match. Once you run your app, Flipper automatically detects it and connects, giving you a central hub with a ton of powerful plugins.
Here’s what the main interface looks like. You can see your connected app and all the available tools ready for inspection.
This screenshot really highlights Flipper’s plugin-based design. In a single window, you can activate tools for Layout, Network, Logs, and so much more, creating a customized debugging dashboard.
Inspecting The Native UI Layout
Ever spent hours fighting a styling bug where a component refuses to align on Android, even though your CSS-in-JS seems flawless? More often than not, it’s a native layout problem. Flipper’s Layout Inspector plugin is built for this exact scenario. It gives you a live, interactive tree of the native UI elements that your React Native components actually render.
With the Layout Inspector, you can finally see what’s really going on under the hood:
- Click on any element in your app and immediately see its corresponding native view highlighted in the hierarchy.
- Inspect and tweak native properties like padding, margins, or dimensions on the fly to see how it affects your layout.
- Spot hidden containers or weird view nesting that might be throwing off your styles.
This tool is a lifesaver for those stubborn styling bugs that are invisible from the JavaScript side. It helps you build a mental model of how your declarative React code translates into the platform’s underlying UI framework.
Monitoring And Mocking Network Requests
While Chrome DevTools has a decent network tab, Flipper’s Network Inspector plugin is often more reliable, especially when it comes to capturing native-level traffic. It logs every single request your app makes, letting you dig into headers, payloads, and responses just like you would in a web browser.
But where Flipper really pulls ahead is its ability to mock API responses. Imagine you need to test how your app handles a 500 server error or an empty data array from an API. Instead of bugging a backend dev to set up a specific test endpoint, you can just intercept the request in Flipper and create your own mock response. This feature is a massive time-saver for building resilient, error-proof features.
A huge advantage of modern tools like Flipper is how they pair with architectural shifts in the ecosystem. React Native’s new architecture, for example, dramatically boosts performance by streamlining communication between JS and native code. Core pieces like TurboModules and the Fabric Renderer make app behavior more predictable, which in turn makes debugging much easier. In fact, developers often report 30-50% faster debugging cycles thanks to these improvements.
Integrating Powerful Community Plugins
Flipper’s true strength lies in its vast plugin ecosystem. Beyond the default tools, you can pull in a huge range of community-built plugins designed for specific libraries and workflows. This transforms Flipper from a simple debugger into a central command center for almost every part of your application.
Here are a few must-have plugins to get you started:
- Redux Debugger: An absolute must if you use Redux. It lets you time-travel through state changes and inspect every action as it’s dispatched.
- React Navigation: Helps you untangle complex navigation stacks by giving you a visual map of your app’s screens, routes, and parameters.
- Crash Reporter: Forget digging through device logs. This plugin shows you native crash logs from your device right inside Flipper.
- Device Logs: See a live stream of system logs from Logcat (Android) or Console (iOS) without ever needing to open Android Studio or Xcode.
By combining these tools, you get a complete, end-to-end view of your app’s health. For more detailed guides and advanced use cases, check out our comprehensive articles about using Flipper in React Native development. This integrated approach helps you move beyond basic console.log statements and empowers you to solve issues across the entire stack, from a single line of JavaScript to the deepest native layers.
Getting Ahead of Bugs with Proactive Error Handling
Fixing bugs is part of the job. But building an app that anticipates them? That’s next-level. The real goal is to shift your mindset from simply reacting to problems to actively preventing them from taking your app down. It’s all about catching errors gracefully and making sure you get detailed reports when things inevitably go sideways out in the wild.
The last thing you want is a single, faulty component to crash your entire application. By building in some resilience, you can create a much smoother user experience, even when things are breaking behind the scenes.
Containing UI Failures with Error Boundaries
One of the best tools React gives us for this is the Error Boundary. In simple terms, an Error Boundary is a special component that acts like a safety net. It catches JavaScript errors happening anywhere within its child components, logs them, and shows a fallback UI instead of a crashed screen.
Think of it as a circuit breaker for your interface. If a component fails to render—maybe because of a null prop or a network request that timed out—the Error Boundary trips. It contains the issue, stopping the error from bubbling up and crashing everything. Your user sees a helpful “Something went wrong” message, while the rest of the UI keeps working just fine.
This is a massive improvement over the dreaded white screen of death. You can wrap Error Boundaries around individual features, entire screens, or even your root navigator. This containment strategy is a cornerstone of a solid debugging approach in any React Native app.
Setting Up a Crash Reporting Service
Error Boundaries are fantastic for handling UI exceptions, but they won’t tell you about the unexpected crashes happening on users’ devices. For that, you absolutely need a dedicated crash reporting service. These tools become your eyes and ears in production, giving you visibility into real-world failures you’d otherwise never know about.
Services like Sentry, Bugsnag, or Firebase Crashlytics are non-negotiable for any serious project. Integrating their SDK is usually straightforward and the payoff is huge. Whenever a crash happens, the service automatically scoops up a detailed report and beams it to your dashboard.
By plugging in a crash reporting service, you’re moving from a position of ignorance to one of insight. Suddenly you can see how your app is performing across thousands of different devices, OS versions, and network conditions—something that’s impossible to replicate on your local machine.
These services don’t just tell you that a crash happened; they give you the context you need to actually solve it.
Capturing Crash Data You Can Actually Use
A crash report is only as good as the information it contains. A stack trace is a start, but it’s rarely enough to solve a tricky bug. To make your reports truly useful, you need to configure your service to capture rich, contextual data.
Your crash reports should always include:
- Device and OS Details: A bug might only surface on an older Android device with limited memory. Knowing the model and OS version is crucial.
- App Version: This helps you pinpoint whether a bug was introduced in a recent update or has been lurking for a while.
- User Breadcrumbs: This is a trail of the user’s last few actions leading up to the crash. Seeing that they tapped Button A, navigated to Screen B, then hit Button C is often the “aha!” moment.
- Application State: If you use a state manager like Redux, attaching a snapshot of the state at the time of the crash can be incredibly revealing.
When you collect this level of detail, you transform a mysterious crash into a clear, reproducible bug ticket. You can learn more about implementing an effective system by checking out different strategies for mobile app crash reporting. This proactive setup is how you start debugging issues with precision long after you’ve shipped your app.
Solving Common React Native Debugging Headaches
Every React Native developer has been there. The sudden red screen of death, a build failure that magically fixes itself on the next try, or that one bug that only shows up on Android. These headaches are practically a rite of passage, but they don’t have to grind your productivity to a halt.
The secret is having a system for hunting down and squashing these bugs. It all starts with accepting the complexity of the ecosystem. React Native’s heavy reliance on third-party libraries and its notoriously tricky upgrade cycle can make debugging feel like a nightmare. In fact, a staggering 70% of developers burn significant time on issues that boil down to version mismatches or library conflicts.
Tackling Third-Party Library Conflicts
One of the most common culprits behind a broken build is a conflict between third-party libraries. You install a new package, and suddenly your app refuses to build or crashes instantly with a cryptic native error. It’s infuriating.
Before you start randomly changing package versions, take a breath. The first place to look is always the library’s documentation. Check the README for its peer dependencies and compatibility tables—often, the answer is right there, telling you exactly which version of React Native it was built for.
If that doesn’t fix it, it’s time to get your hands dirty:
- Nuke the Caches: This command is a mouthful, but it’s my go-to fix:
watchman watch-del-all && rm -rf $TMPDIR/react-* && rm -rf node_modules/ && npm cache clean --force && npm install && npm start -- --reset-cache. It wipes every possible cache that could be holding onto old, conflicting code. - Find Duplicate Dependencies: Run
npm ls <package-name>oryarn why <package-name>. You might discover that a nested dependency is pulling in an older, incompatible version of a library you’re also using directly. - Isolate the Problem: If you have a suspect, try commenting out the import and any code that uses it. If the app builds and runs, you’ve found your troublemaker.
Hunting Down Platform-Specific Bugs
Ah, the classic “it works on my iPhone but not on this Android” bug. When an issue only appears on one platform, the problem almost always lives in the native layer. This could be anything from UI rendering quirks to native module behavior.
Your debugging strategy has to shift. For example, if your layout’s shadows look beautiful on iOS but are completely flat on Android, the issue is likely a styling property. Older Android versions relied on elevation for shadows, and while support has improved, discrepancies still pop up.
Real-World Scenario: Let’s say an API call works flawlessly on iOS but fails silently on Android. My first thought is always network security. Android blocks cleartext (non-HTTPS) traffic by default. You’ll probably need to add a network security configuration to your
AndroidManifest.xmlto whitelist certain domains—a step you don’t need on iOS.
Speaking of APIs, a solid grasp of how HTTP requests work is non-negotiable. Misusing an endpoint can easily cause platform-specific failures, so it never hurts to review fundamentals like understanding HTTP methods like PUT vs PATCH.
Fixing Performance Bottlenecks
Finally, let’s talk about performance. The app works, but it feels sluggish. Animations are choppy, and buttons take a beat too long to respond. Nine times out of ten, the cause is unnecessary re-renders.
This is where the React DevTools Profiler becomes your best friend. Fire it up, record an interaction, and you’ll get a “flame graph” showing exactly which components re-rendered and why. It’s a lifesaver for spotting components that are working way too hard. For even more firepower, check out our guide on other essential React Native development tools.
Once you’ve identified the slowpokes, the fixes are usually straightforward:
- Memoize Components: Wrap your functional components in
React.memo. This simple step prevents them from re-rendering if their props haven’t changed. - Use
useCallbackanduseMemo: These hooks are essential for stabilizing functions and objects. They stop you from creating new instances on every render, which in turn prevents child components from updating when they don’t need to. - Optimize
FlatList: Always use thekeyExtractorprop correctly. For lists with fixed-height items, implementinggetItemLayoutcan give you a massive performance boost.
By coming at these common frustrations with a clear plan, you can turn them from project-derailing roadblocks into simple, manageable tasks.
Common Debugging Questions Answered
When you’re deep in the trenches of debugging a React Native app, the same questions tend to surface over and over. Getting straight answers quickly can be the difference between a frustrating afternoon and a productive one. Let’s walk through some of the most common hurdles I’ve seen developers face.
A great way to keep these solutions handy for your whole team is by following some solid knowledge base best practices. Having a central spot for troubleshooting tips saves everyone a ton of time.
Flipper or Chrome DevTools: Which One Do I Use?
This is probably the first big question every React Native developer asks. Do you stick with the familiar Chrome DevTools, or is it worth diving into Flipper?
Here’s my rule of thumb: Chrome DevTools is your go-to for anything purely JavaScript. It’s fantastic for setting breakpoints in your JS code, stepping through logic, and checking out network requests. It’s fast, lightweight, and does its job incredibly well when the problem lives within your app’s JS thread.
Flipper, however, is your all-in-one diagnostic powerhouse. It handles JavaScript debugging just fine, but its real magic lies in its deep integration with the native side. Need to inspect the native UI hierarchy, check device logs, or investigate a crash? Flipper is your tool. It gives you a complete picture of what’s happening under the hood, not just in the JavaScript world.
My Take: If you’re sure the bug is in your JavaScript, stick with Chrome DevTools for a quick, focused session. The second you suspect the problem might involve native modules, the UI layout, or something device-specific, pivot to Flipper immediately.
How Do I See Native Console Logs?
It’s a classic moment of frustration: you’ve added a NSLog or Log.d statement, but nothing shows up in your Metro or Chrome console. That’s because the JavaScript console is completely separate from the native logging systems.
To get a look at those native logs, you have to use the platform’s dedicated tools:
- For iOS: The simplest way is to run your app directly from Xcode. The console pane at the bottom of the Xcode window will stream every log message coming from the simulator or your connected iPhone.
- For Android: Fire up Android Studio and open the Logcat window. This gives you a powerful, searchable, and filterable firehose of every log from your app and the Android OS itself.
If you’re already using Flipper, its built-in Device Logs plugin is a lifesaver. It pulls in logs from both iOS and Android and presents them in a single, unified view. No more bouncing between different IDEs.
Why Does My App Crash in Release Mode but Not Debug?
Ah, the dreaded production-only crash. Your app runs flawlessly on your simulator, but the build you ship to testers or the app store crashes on launch. This almost always comes down to the optimizations and configurations that are only enabled for release builds.
I’ve found the issue usually boils down to one of these culprits:
- Aggressive Code Stripping: On Android, ProGuard (or R8) works to shrink your app’s size by removing what it thinks is unused code. Sometimes it gets a little too aggressive and strips out something essential, leading to a crash. You’ll need to double-check your ProGuard rules.
- Hermes Engine Optimizations: The Hermes JavaScript engine is highly optimized for release builds, which can sometimes expose subtle bugs in your code that the less-optimized debug environment didn’t catch.
- Native Module Linking Glitches: Sometimes, a native module that worked perfectly during development doesn’t get linked correctly in the final packaged app.
The absolute first thing you should do is check your crash reporting tool, like Sentry or Bugsnag. The stack traces and device info in those crash reports are your best clues for figuring out what’s actually going wrong in the wild.
At CodePushGo, we help you move past these debugging cycles by enabling instant, over-the-air updates. Fix bugs in production within minutes, not days, by shipping code directly to users without waiting for app store reviews. Explore CodePushGo today.