Level Up Your DevOps with the Right Monitoring Tools
Quickly find the best monitoring tools for DevOps to improve your development lifecycle. Downtime and performance issues cost time and money. This list of top 10 monitoring tools for DevOps in 2025 helps you select the right solution for your needs and budget. We cover open-source options like Prometheus, Grafana, Nagios, Elastic Stack (ELK), and Zabbix, as well as enterprise-grade platforms such as Datadog, New Relic, AppDynamics, SolarWinds, and Dynatrace. Discover the key features, advantages, and disadvantages of each, enabling you to optimize your monitoring strategy and achieve seamless deployments.
1. Prometheus
Prometheus stands as a leading open-source monitoring solution, specifically designed for the dynamic and complex nature of modern DevOps environments. Born from SoundCloud and now a graduated project of the Cloud Native Computing Foundation (CNCF), Prometheus offers a robust and scalable platform for collecting, storing, and querying time-series data. Its dimensional data model, coupled with the powerful PromQL query language, makes it particularly well-suited for monitoring microservices and containerized applications, giving DevOps teams deep insights into their system’s performance and health. It earns a top spot on this list due to its comprehensive feature set, active community support, and proven reliability in handling large-scale monitoring tasks. This makes it a valuable tool for everyone from React Native developers looking at specific app performance metrics to product managers requiring a bird’s-eye view of system health.
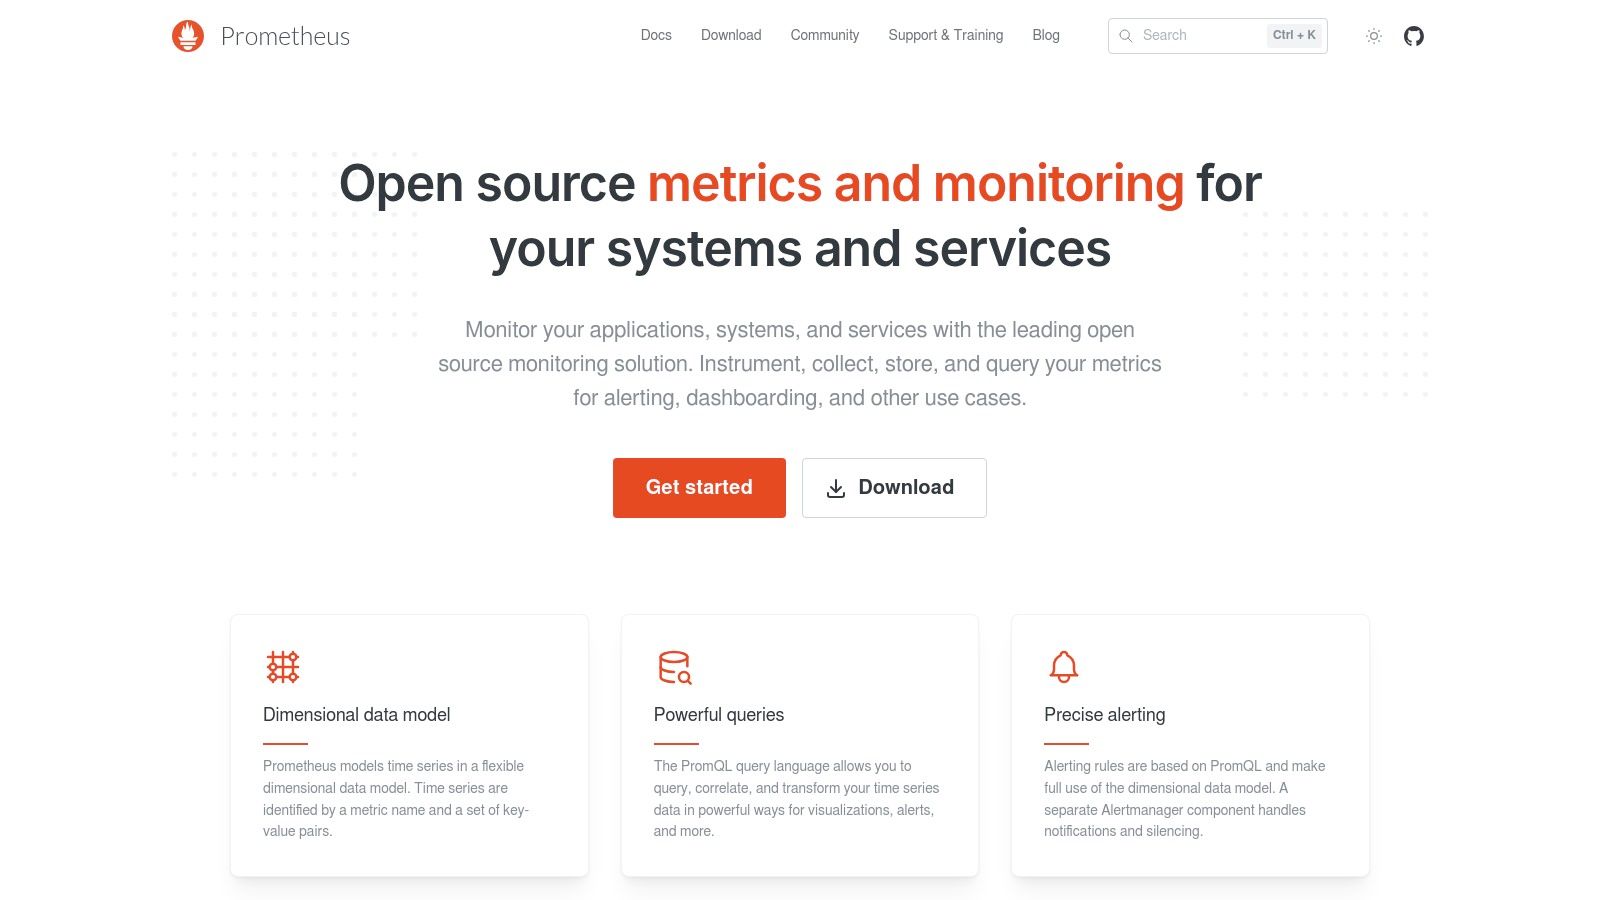
At its core, Prometheus leverages a pull-based metrics collection system. This means that Prometheus actively scrapes metrics from configured HTTP endpoints exposed by your applications and services. This approach simplifies deployment and reduces the burden on monitored systems. Prometheus’s service discovery integrations further enhance its capabilities in dynamic environments, automatically detecting new services and adding them to the monitoring scope. This is particularly useful for container orchestration platforms like Kubernetes, where services are constantly being created and destroyed. For managing alerts and notifications, Prometheus integrates seamlessly with Alertmanager, allowing for sophisticated alert routing, grouping, and silencing, ensuring that critical issues are addressed promptly. For those interested in delving into testing within a continuous integration pipeline, you can learn more about Prometheus and its related tooling.
One of Prometheus’s key strengths lies in its multi-dimensional data model. Unlike traditional monitoring systems that rely on tags or key-value pairs, Prometheus uses labels to create rich, multi-dimensional metrics. This allows for flexible and powerful querying with PromQL, enabling DevOps engineers to slice and dice data based on various dimensions, such as service name, pod name, or environment. This granular control over data retrieval is crucial for identifying the root cause of performance issues in complex systems.
Prometheus also shines in terms of scalability and reliability. Its distributed architecture, combined with a highly efficient time-series database, allows it to handle large volumes of metrics data from thousands of endpoints. This robust design makes Prometheus an ideal choice for monitoring large-scale, distributed systems, ensuring uninterrupted performance monitoring even under heavy load. Security-conscious organizations will appreciate its focus on stability and performance, allowing them to reliably track and analyze security-relevant metrics.
While Prometheus offers a powerful and comprehensive monitoring solution, there are some considerations to keep in mind. Setting up and configuring Prometheus initially can be challenging, especially for users unfamiliar with its architecture and PromQL. The learning curve associated with PromQL, while ultimately rewarding, can be steep. Additionally, Prometheus’s built-in long-term storage capabilities are limited. While suitable for short-term data retention, long-term storage often requires integrating with external time-series databases like Thanos or Cortex. Finally, building a comprehensive monitoring stack usually necessitates supplementing Prometheus with other tools for visualizing data, such as Grafana, which provides rich dashboards and visualizations.
Despite these minor drawbacks, the advantages of Prometheus, especially its open-source nature, powerful query language, and robust architecture, outweigh the challenges for many organizations, making it a premier choice for monitoring tools for DevOps. This is especially true for those focused on microservices and containerized environments, aligning perfectly with the needs of React Native developers, DevOps engineers, and QA teams looking for powerful and flexible monitoring capabilities. The active community and comprehensive documentation further enhance its appeal, providing ample resources and support for users. The website (https://prometheus.io) provides detailed documentation, downloads, and community resources for those interested in learning more. As it is entirely free and open-source, it provides a powerful entry point for teams looking to enhance their monitoring capabilities without significant upfront investment.
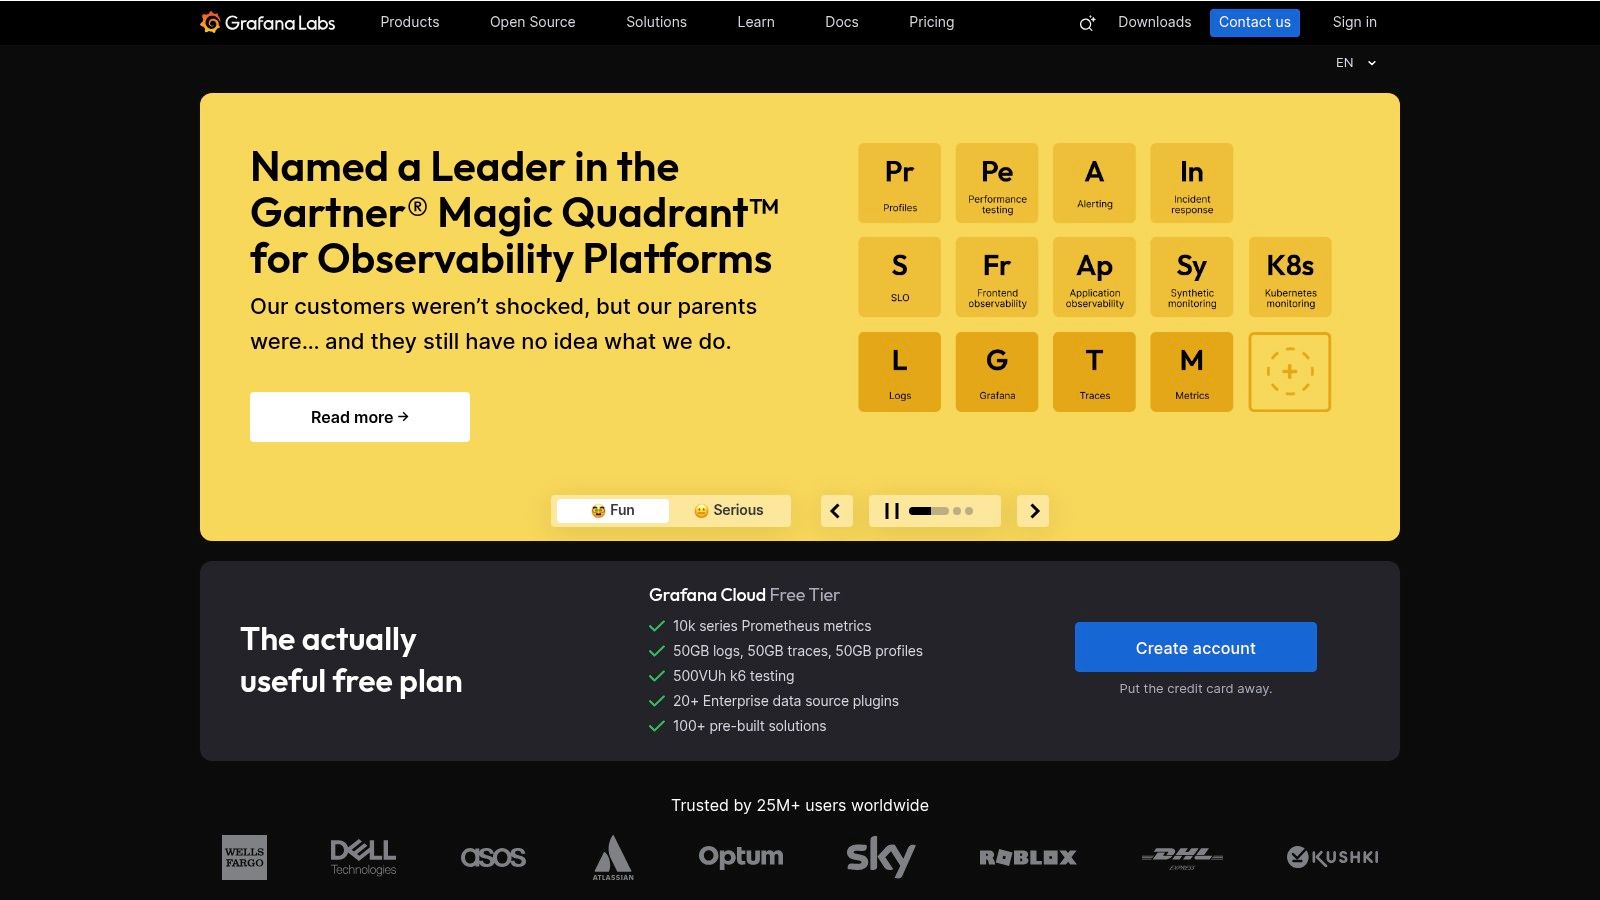
2. Grafana
Grafana is a powerful open-source analytics and interactive visualization web application, earning its spot on this list of essential monitoring tools for DevOps. It excels at transforming raw data from various sources into insightful charts, graphs, and alerts, enabling teams to effectively monitor their infrastructure and application performance. Its highly customizable dashboards make it a versatile solution for visualizing everything from system resource usage to application-specific metrics. Whether you’re a React Native developer tracking API response times, a DevOps engineer monitoring server health, or a product manager seeking real-time insights into user behavior, Grafana provides a visually compelling and informative platform.
One of Grafana’s key strengths is its ability to connect to a wide range of data sources, exceeding 50 supported platforms. This multi-source data visualization capability means you can seamlessly integrate metrics from databases like Prometheus, InfluxDB, Graphite, and Elasticsearch, alongside cloud monitoring services like AWS CloudWatch and Azure Monitor. This allows for a consolidated view of your entire tech stack within a single dashboard. For instance, a DevOps team can monitor server CPU usage alongside database query performance and application error rates, providing a holistic understanding of system health and performance bottlenecks. This comprehensive view simplifies troubleshooting and enables quicker identification of the root causes of issues. Learn more about Grafana and how it can elevate your application performance monitoring dashboards.
Grafana’s highly customizable and shareable dashboards are another major advantage. Users can create tailored visualizations with various panel types, ranging from simple graphs and gauges to heatmaps and world maps, all designed to suit specific monitoring needs. This flexibility allows teams to visualize data in a way that makes the most sense for their particular applications and workflows. The ability to share these dashboards fosters collaboration within teams, ensuring everyone has access to the same critical information.
Furthermore, Grafana offers advanced alerting capabilities through multiple notification channels. When metrics cross predefined thresholds, Grafana can trigger alerts via email, Slack, PagerDuty, and other platforms. This allows for proactive monitoring and rapid response to potential issues before they impact users. For example, if an API endpoint experiences a sudden increase in response time, an alert can be triggered, notifying the relevant team to investigate and address the problem. This proactive approach minimizes downtime and ensures a positive user experience.
Grafana also benefits from a rich plugin ecosystem, extending its core functionality. Plugins can add support for new data sources, panel types, and data transformations. This allows for a high degree of customization and allows teams to tailor Grafana to their specific needs. The large library of community dashboards further simplifies setup and configuration. These pre-built dashboards offer a starting point for various monitoring scenarios, saving teams valuable time and effort.
While Grafana provides robust visualization capabilities, it’s important to acknowledge its limitations. It primarily focuses on visualization and requires separate data collection tools. Therefore, you’ll need to integrate it with tools like Prometheus or InfluxDB to gather the metrics you want to visualize. Complex dashboards can also become resource-intensive, requiring sufficient server resources to ensure optimal performance. Finally, while Grafana offers a free open-source version, enterprise features like advanced security and user management require paid licensing. Dashboard management can also become complex at scale, requiring careful planning and organization.
Grafana is available in both open-source and commercially licensed enterprise versions. The open-source version is free to use and offers a comprehensive set of features. The Grafana Enterprise version adds features like advanced security, data source access control, and enterprise support. Specific pricing for the enterprise version is available on their website.
For implementation, Grafana can be installed on various operating systems and cloud platforms. The installation process is generally straightforward, involving downloading the appropriate package and following the installation instructions. Once installed, you’ll need to configure data sources and begin creating your dashboards.
In comparison to other monitoring tools like Kibana, which is closely tied to the Elastic Stack, Grafana offers broader data source compatibility, making it a more versatile choice for organizations using a diverse range of technologies. While tools like Datadog and New Relic offer all-in-one monitoring solutions, Grafana’s open-source nature and extensive customization options make it a compelling choice, especially for cost-conscious organizations and those requiring a high degree of flexibility.
3. Datadog
Datadog is a powerful, cloud-based monitoring and analytics platform designed to provide full-stack observability across applications, infrastructure, and logs. Its comprehensive approach empowers DevOps teams with real-time monitoring capabilities, augmented by machine learning-powered insights and a wide range of integrations. This makes Datadog a valuable tool for maintaining application uptime, optimizing performance, and troubleshooting issues quickly. For organizations embracing DevOps practices, having a centralized platform like Datadog to monitor the entire application lifecycle is crucial for efficient development and deployment. It fills the gap between development, operations, and security teams by offering a single source of truth for application performance and health.
One of Datadog’s core strengths lies in its full-stack monitoring capabilities. From infrastructure metrics like CPU usage and network latency to application performance metrics like error rates and request latency, and even log analysis, Datadog provides a holistic view of your system. This unified perspective enables faster identification of performance bottlenecks and root cause analysis during incidents. For React Native developers, understanding how their application interacts with backend services and the underlying infrastructure is critical. Datadog’s tracing capabilities allow them to follow requests across different services, pinpointing latency issues and optimizing application performance.
Furthermore, Datadog’s AI-powered anomaly detection and forecasting features are invaluable for proactive monitoring. By analyzing historical data, Datadog can predict potential performance issues and alert teams before they impact users. This proactive approach to monitoring is particularly useful for DevOps teams managing complex applications with numerous dependencies. It helps them stay ahead of potential problems, minimizing downtime and ensuring a smooth user experience. Release engineers can utilize these forecasting features to anticipate potential scaling needs during new releases and proactively adjust infrastructure accordingly. For QA and beta testing teams, Datadog offers a robust platform for monitoring application performance during testing phases, allowing them to identify and address issues early in the development cycle.
Datadog’s comprehensive integration ecosystem is another key advantage. With over 400 integrations with popular tools and services, including various CI/CD tools (you can learn more about Datadog and how it fits into a CI/CD pipeline), it seamlessly fits into existing DevOps workflows. This allows teams to centralize their monitoring data and avoid switching between different tools, increasing efficiency and collaboration. For security-conscious enterprise organizations, Datadog provides robust security monitoring capabilities, including threat detection and vulnerability assessment, ensuring compliance with industry regulations. Product managers can leverage Datadog’s real-time dashboards and custom metrics to gain insights into product usage, user behavior, and overall application performance, enabling data-driven decision-making.
While Datadog offers a compelling feature set, it’s essential to be aware of the potential drawbacks. The platform’s pricing can be a significant factor, especially for large-scale deployments with high data volumes. Users should carefully evaluate their needs and choose a plan that aligns with their budget. The potential for vendor lock-in is another consideration, as migrating away from Datadog’s proprietary platform can be complex. Finally, some advanced features, such as long-term data retention and certain AI-powered functionalities, require higher-tier plans, adding to the overall cost. Data retention policies, in particular, can become a significant cost factor if historical data analysis is a critical requirement.
Implementation of Datadog typically involves installing agents on servers and configuring the platform to collect relevant metrics and logs. The platform’s intuitive drag-and-drop interface makes creating custom dashboards and alerts straightforward. However, to fully leverage Datadog’s advanced features and machine learning capabilities, some training and expertise may be required. Effective use of Datadog’s features requires careful planning and configuration to avoid alert fatigue and ensure the platform provides actionable insights.
Despite these potential drawbacks, Datadog’s robust feature set, user-friendly interface, and extensive integration ecosystem make it a strong contender for DevOps teams seeking a comprehensive monitoring solution. It provides the necessary tools and insights to improve application performance, reduce downtime, and streamline DevOps workflows, making it a valuable asset in the modern software development landscape. Visit the Datadog website to learn more.
4. New Relic
New Relic is a robust, cloud-based observability platform ideal for DevOps teams seeking comprehensive monitoring across their entire technology stack. It offers a unified view of application performance, infrastructure health, and digital customer experience, making it a valuable tool for identifying and resolving issues quickly. This comprehensive approach allows teams to gain a holistic understanding of their system’s performance and pinpoint bottlenecks across different layers of their architecture. For DevOps teams looking to streamline their monitoring efforts and gain actionable insights, New Relic provides a powerful solution. This platform is particularly valuable in today’s complex software environments, where microservices, distributed systems, and cloud-native architectures are becoming increasingly prevalent. By correlating data from various sources, New Relic empowers teams to effectively manage and optimize their modern applications. It’s no surprise that New Relic is a prominent player among monitoring tools for devops.
New Relic offers a suite of interconnected monitoring capabilities. Its Application Performance Monitoring (APM) provides deep insights into transaction traces, allowing developers to identify slow database queries, inefficient code segments, and other performance bottlenecks. This granular level of detail enables targeted optimization efforts, leading to improved application responsiveness and user satisfaction. Learn more about New Relic and best practices surrounding APM. Its infrastructure monitoring provides visibility into server and container metrics, enabling proactive detection of potential infrastructure issues before they impact application performance. Furthermore, its browser and mobile application monitoring capabilities provide critical insight into the end-user experience, allowing teams to identify and address client-side performance issues that may be impacting user engagement and conversion rates.
One of New Relic’s standout features is its AI-powered incident intelligence. This capability leverages machine learning algorithms to automatically detect anomalies, correlate events, and provide root cause analysis. This significantly reduces the time and effort required for troubleshooting and helps prevent major outages. These proactive insights are particularly valuable for DevOps teams, as they enable faster incident response and improve overall system stability. For React Native developers specifically, New Relic provides mobile monitoring allowing for in-depth performance analysis and crash reporting, crucial for ensuring a seamless user experience across different devices. This feature is particularly helpful for QA and beta testing teams, as it provides detailed performance data and user feedback during testing phases.
Beyond its core monitoring capabilities, New Relic offers custom dashboards and alerting. This allows teams to tailor their monitoring views and receive notifications about critical events. This customization ensures that teams receive only relevant information, avoiding alert fatigue and allowing them to focus on the most pressing issues. For security-conscious enterprise organizations, New Relic offers robust security features, including data encryption and access control, ensuring the confidentiality and integrity of sensitive performance data.
While New Relic offers a powerful and comprehensive platform, it’s important to consider the potential drawbacks. Pricing can be a significant concern, particularly for larger organizations with extensive monitoring needs. Some users have also reported occasional data accuracy issues, which can impact the reliability of insights. Furthermore, the platform has a learning curve for its more advanced features, requiring time and effort for teams to fully utilize its potential. Finally, compared to open-source alternatives, New Relic offers less flexibility in terms of customization.
Key Features:
- Application Performance Monitoring (APM) with distributed tracing
- Infrastructure monitoring (servers, containers, cloud platforms)
- Browser and mobile application monitoring
- AI-powered incident intelligence and root cause analysis
- Custom dashboards and alerting
Pros:
- Comprehensive observability across the full technology stack
- Strong APM capabilities with detailed transaction tracing
- AI-powered insights for proactive issue detection
- Good integration with CI/CD pipelines
Cons:
- Pricing can be high for larger organizations
- Occasional data accuracy issues reported by some users
- Learning curve for advanced features
- Limited customization compared to open-source alternatives
Website: https://newrelic.com
Despite its potential downsides, New Relic remains a valuable tool for DevOps teams seeking a comprehensive and integrated monitoring solution. Its powerful features, combined with AI-powered insights, enable proactive issue detection and resolution, leading to improved application performance and stability. This makes it a strong contender in the realm of monitoring tools for devops, especially for product managers seeking real-time insights into application and infrastructure performance. However, organizations should carefully consider their budget and technical expertise before committing to the platform.
5. Nagios: A Veteran Monitoring Solution for DevOps
Nagios is a powerful and widely respected open-source monitoring system ideal for DevOps teams seeking robust and customizable infrastructure monitoring. It excels at keeping tabs on the health and performance of systems, networks, and applications, providing comprehensive oversight and alerting capabilities. Having been a cornerstone of IT monitoring for over two decades, Nagios offers a mature and battle-tested platform for ensuring the stability and reliability of critical infrastructure. Its extensive plugin ecosystem allows it to adapt to a wide range of monitoring scenarios, making it a versatile choice for DevOps teams managing complex environments. If you’re searching for effective monitoring tools for DevOps, Nagios certainly deserves consideration.
For DevOps teams, Nagios provides valuable insight into the operational status of their entire infrastructure. It allows them to proactively identify potential issues, minimizing downtime and ensuring smooth application delivery. For example, during a deployment, Nagios can monitor server resource utilization, application performance, and network latency, alerting the team to any anomalies that may impact the release. This real-time monitoring empowers DevOps engineers to react quickly and efficiently to resolve issues before they escalate. Furthermore, the historical data analysis and reporting features enable trend identification and capacity planning, aiding in optimizing infrastructure performance and resource allocation.
Nagios shines with its comprehensive network, server, and application monitoring capabilities. It supports a wide range of protocols and services, including HTTP, SMTP, SSH, and ping, allowing you to monitor virtually any aspect of your infrastructure. Its flexible notification and alerting system provides real-time alerts via email, SMS, or other methods, ensuring that critical incidents are addressed promptly. This is especially important for DevOps teams practicing continuous integration and continuous delivery (CI/CD), where rapid feedback loops are essential.
The extensive plugin architecture is a significant strength of Nagios. Thousands of community-developed plugins are available, extending its functionality to cover a vast array of technologies and services. This allows DevOps teams to tailor their monitoring setup to their specific needs, integrating with various tools and platforms within their ecosystem. Whether you need to monitor Docker containers, Kubernetes clusters, or cloud-based services, there’s likely a Nagios plugin that fits the bill.
While Nagios offers undeniable power and flexibility, it’s important to be aware of its complexities. The configuration process can be challenging and time-consuming, often requiring a deep understanding of the underlying system. The user interface, though functional, feels somewhat dated compared to more modern monitoring tools. Setting up and maintaining Nagios can require significant manual effort, potentially straining resources. Lastly, built-in visualization capabilities are somewhat limited compared to newer solutions, often necessitating integration with external graphing tools for more sophisticated data analysis.
Despite these drawbacks, Nagios remains a popular choice for DevOps teams due to its maturity, reliability, and customizability. Both open-source (Nagios Core) and commercially supported versions (Nagios XI) are available. Nagios Core is free to use but requires manual installation and configuration. Nagios XI provides a more user-friendly interface and additional features like automated discovery and configuration wizards, but comes with a licensing fee. Technical requirements vary depending on the scale and complexity of your monitoring setup, but generally involve a Linux server with sufficient resources.
For teams considering implementing Nagios, several tips can ease the process: start with a small-scale deployment and gradually expand; leverage the extensive documentation and community support resources; utilize pre-configured templates and wizards where available; and explore integration with configuration management tools to automate tasks.
Compared to newer cloud-based monitoring solutions like Datadog or New Relic, Nagios offers greater control and customization but demands more manual effort. Tools like Prometheus and Grafana provide a strong open-source alternative with modern visualization capabilities but require a different approach to monitoring configuration. Ultimately, the choice depends on your specific needs and priorities. If you require a highly customizable, battle-tested monitoring solution and are willing to invest the time in setup and maintenance, Nagios is a powerful option for ensuring the reliability and performance of your DevOps infrastructure. You can learn more and download Nagios from their website: https://www.nagios.org
6. Elastic Stack (ELK)
The Elastic Stack, often referred to as ELK, is a powerful open-source suite of tools ideal for DevOps teams seeking comprehensive monitoring and log analysis capabilities. Comprising Elasticsearch, Logstash, Kibana, and Beats, ELK provides a centralized platform for collecting, processing, analyzing, and visualizing data from various sources across your infrastructure. This makes it a top contender amongst monitoring tools for DevOps, offering valuable insights into application performance, system health, and security threats. Its robust search and analytics features enable teams to quickly pinpoint issues, identify trends, and proactively address potential problems, contributing to improved system reliability and faster incident resolution.
At the heart of the Elastic Stack lies Elasticsearch, a distributed, RESTful search and analytics engine capable of handling massive volumes of data. Logstash acts as the central processing pipeline, ingesting data from diverse sources like servers, applications, and network devices. It then parses, enriches, and transforms this data before sending it to Elasticsearch for storage and indexing. Kibana provides the visualization layer, allowing users to create interactive dashboards, charts, and graphs to explore and analyze the indexed data. Finally, Beats are lightweight data shippers installed on edge devices to collect and forward various types of data, including logs, metrics, and network traffic, to Logstash or directly to Elasticsearch.
For DevOps teams, ELK offers a centralized platform for monitoring application performance, tracking system logs, identifying security threats, and analyzing user behavior. For example, React Native app developers can integrate Beats to collect mobile app logs and performance metrics, allowing them to monitor app crashes, identify bottlenecks, and understand user engagement. DevOps and release engineers can leverage ELK to monitor infrastructure health, track deployments, and analyze server logs for troubleshooting. QA and beta testing teams can use ELK to analyze test results and identify potential bugs. Security-conscious enterprise organizations can implement ELK for security information and event management (SIEM), detecting and responding to security threats in real-time. Product managers can gain valuable insights into user behavior and product usage patterns through Kibana dashboards, informing product development and marketing strategies.
ELK’s scalability is a key advantage, particularly for organizations dealing with large data volumes. Elasticsearch’s distributed architecture allows for horizontal scaling, enabling the system to handle increasing data loads. Its flexible data ingestion capabilities also allow it to integrate with a wide array of data sources, offering a unified view of your entire infrastructure. Kibana’s powerful visualization tools empower users to create customized dashboards that cater to specific monitoring needs, from real-time system health overviews to historical trend analysis.
However, managing an ELK stack can be resource-intensive and require specialized expertise, especially for larger deployments. Optimizing performance requires careful configuration and tuning of Elasticsearch, Logstash, and Kibana. While the core components are open-source, certain enterprise features, such as security and machine learning capabilities, require a paid subscription. Furthermore, storage costs can accumulate quickly depending on the volume of data ingested and the retention policies implemented.
Compared to other monitoring tools for DevOps like Splunk and Datadog, ELK offers greater flexibility and customization due to its open-source nature. While Splunk and Datadog provide more user-friendly interfaces and pre-built integrations, ELK’s open-source licensing allows for greater control and avoids vendor lock-in.
For implementing ELK, consider starting with a small proof-of-concept project to familiarize yourself with the tools. Utilize pre-built configurations and dashboards available online to accelerate the setup process. As your needs grow, explore advanced features like machine learning for anomaly detection and alerting. Optimize Elasticsearch indexing and sharding strategies for optimal performance. Carefully plan your data retention policies to manage storage costs.
Elastic offers various pricing tiers for its enterprise features, ranging from free basic features to paid subscriptions for advanced functionalities like security, machine learning, and observability. The website (https://www.elastic.co) provides detailed information on pricing and available features. By leveraging the power of the Elastic Stack, DevOps teams can gain valuable insights into their systems, enhance their monitoring capabilities, and improve overall system reliability.
7. Zabbix
Zabbix stands as a robust, enterprise-class open-source monitoring solution catering to a diverse range of IT components, including networks, servers, cloud services, and applications. Its comprehensive feature set, real-time monitoring capabilities, and flexible alerting system make it a powerful tool for DevOps teams seeking in-depth visibility into their infrastructure and application performance. This makes Zabbix a compelling choice for organizations of all sizes, especially those already invested in or comfortable with open-source solutions. For DevOps teams looking for a powerful, adaptable monitoring tool, Zabbix offers a wealth of features without the licensing fees associated with proprietary solutions.
Zabbix’s strength lies in its versatility. It supports both agent-based and agentless monitoring, providing flexibility in how you monitor your environment. Agent-based monitoring, utilizing lightweight agents installed on target systems, offers granular data collection and is ideal for performance-intensive applications and servers. Agentless monitoring, on the other hand, eliminates the need for agent installation and is suitable for network devices, simpler services, or scenarios where agent deployment is challenging. This dual approach makes Zabbix applicable to a wide range of monitoring scenarios faced by DevOps teams, from tracking the health of individual servers to monitoring the performance of complex distributed applications.
Real-time monitoring, delivered through a web-based interface with customizable dashboards, empowers DevOps teams with immediate insights into system and application health. This real-time visibility is critical for identifying and addressing performance bottlenecks, ensuring application availability, and minimizing downtime. Zabbix’s automated discovery of network devices and services streamlines the initial setup process, automatically detecting and adding new components to the monitoring system. This automation is a boon for dynamic environments where infrastructure changes frequently.
Zabbix’s flexible alerting and notification system allows DevOps engineers to define specific thresholds and trigger alerts based on various metrics. This proactive approach ensures that teams are notified of potential issues before they escalate into significant problems, enabling swift remediation. Historical data storage and trend analysis features within Zabbix provide valuable long-term insights into system and application behavior. This historical data can be leveraged for capacity planning, performance optimization, and identifying recurring issues.
For React Native developers, Zabbix can monitor backend server infrastructure and APIs, ensuring the smooth operation of the mobile application’s supporting services. DevOps and release engineers benefit from Zabbix’s comprehensive monitoring and alerting, which facilitates streamlined deployments and rapid issue resolution. QA and beta testing teams can use Zabbix to monitor application performance under various test scenarios, contributing to a higher quality product. Security-conscious enterprise organizations appreciate Zabbix’s ability to monitor security-related metrics and detect potential vulnerabilities. Product managers gain real-time insights into application performance and user experience, enabling data-driven decision-making.
Pricing and Technical Requirements: Zabbix is entirely free and open-source, offering exceptional value for organizations of all sizes. However, while the software is free, it does require server resources for installation and operation, including a web server, database server, and potentially dedicated Zabbix server instances depending on the scale of your monitoring environment. Familiarization with Linux server administration is generally recommended for setup and maintenance.
Comparison and Implementation Tips: Compared to other monitoring tools like Nagios, Zabbix offers a more modern web interface and broader out-of-the-box functionality. However, Zabbix’s initial setup can be more complex. When implementing Zabbix, start by defining your monitoring objectives and identifying key metrics. Begin with a smaller subset of devices and services to gain experience with the platform before scaling up to a larger deployment. Leverage the extensive Zabbix documentation and community resources for guidance and support during the implementation process.
While Zabbix boasts numerous advantages, it’s important to acknowledge its drawbacks. The initial setup and configuration can be complex, presenting a steep learning curve for new users. The user interface, while functional, could benefit from modernization. While Zabbix’s cloud-native monitoring capabilities are continually improving, they may not be as advanced as some dedicated cloud monitoring solutions. Finally, large-scale deployments require dedicated resources, including potentially multiple Zabbix server instances for optimal performance. Despite these challenges, Zabbix’s powerful features, open-source nature, and active community make it a valuable tool in the DevOps arsenal for comprehensive monitoring and management of complex IT environments (https://www.zabbix.com).
8. AppDynamics
AppDynamics, a Cisco-owned application performance monitoring (APM) solution, offers comprehensive monitoring capabilities specifically designed for enterprise applications. It distinguishes itself through its business transaction monitoring and focus on correlating application performance with user experience and business impact. This makes it a valuable tool for DevOps teams seeking to optimize application performance and directly tie it to business outcomes, making it a strong contender among the best monitoring tools for DevOps. This tool is particularly relevant for complex, distributed applications where understanding the impact of performance on business metrics is crucial.

DevOps teams benefit from AppDynamics’ deep code-level visibility into business transactions, enabling them to pinpoint bottlenecks and performance issues quickly. This granular view helps identify the root cause of problems affecting user experience and revenue streams. Furthermore, its AI-powered analytics and anomaly detection proactively highlight potential issues before they impact users. These features, coupled with real user monitoring (RUM) and synthetic monitoring, empower DevOps teams with a 360-degree view of application health and performance, both from the user perspective and from simulated scenarios.
AppDynamics shines in its ability to connect application performance with business context. This feature is particularly valuable for product managers who can track the impact of releases and feature changes on key performance indicators (KPIs) and revenue. The business impact analysis capabilities provide actionable insights that directly link performance data to business outcomes, enabling data-driven decisions for optimization and resource allocation. For security-conscious organizations, understanding the performance impact of security measures can be crucial, and AppDynamics facilitates this analysis.
While AppDynamics boasts comprehensive features, implementing and configuring the tool can be complex and require significant resources for full deployment. Its enterprise-grade functionality comes with a price tag, and the licensing costs can be high, particularly for organizations requiring the full suite of features. Although it offers infrastructure monitoring capabilities with automatic discovery, its primary focus remains application performance monitoring. This makes it a less suitable choice for organizations primarily seeking infrastructure-centric monitoring tools for DevOps. Compared to tools like Datadog or Prometheus, which offer more broad spectrum monitoring including logs and infrastructure metrics, AppDynamics offers a more specialized approach centered on application performance and business context.
Practical Applications and Use Cases:
- E-commerce: Pinpointing performance bottlenecks affecting checkout processes and correlating them with lost revenue.
- Financial Services: Monitoring transaction processing speeds and ensuring regulatory compliance.
- SaaS Platforms: Tracking user engagement metrics and identifying performance issues impacting customer satisfaction.
- Gaming: Analyzing server performance and identifying latency issues impacting gameplay.
Implementation and Setup Tips:
- Start small: Begin by monitoring critical business transactions and gradually expand coverage.
- Leverage the AI-powered analytics: Utilize the anomaly detection capabilities to proactively identify potential issues.
- Integrate with existing tools: AppDynamics offers integrations with popular DevOps tools, maximizing the value of existing investments.
- Invest in training: AppDynamics’ comprehensive feature set requires dedicated training for effective utilization.
Pricing and Technical Requirements:
AppDynamics offers tiered pricing based on the features and level of monitoring required. Specific pricing details are available upon request from AppDynamics directly. The platform supports a wide range of application environments and integrates with various cloud providers. Detailed technical requirements are available on the AppDynamics website.
Conclusion:
AppDynamics is a powerful application performance monitoring tool for DevOps teams seeking deep insights into application behavior and its impact on business outcomes. Its strength lies in connecting technical performance with business context, making it invaluable for data-driven decision-making. However, its complexity and high cost make it a more suitable choice for large enterprises with complex applications and a need for in-depth business transaction monitoring. AppDynamics
9. SolarWinds
SolarWinds is a well-established player in the IT monitoring space, offering a comprehensive suite of tools designed to provide visibility into every layer of your infrastructure. This makes it a potent, albeit sometimes complex, option for DevOps teams looking for a single pane of glass to monitor everything from network devices to application performance. It earns its place on this list due to its breadth of features, strong visualization capabilities, and flexible deployment options, making it suitable for a range of organizational needs and existing infrastructure setups. While it may not be the perfect fit for every team, especially smaller organizations or those heavily focused on modern DevOps practices like container orchestration, its power and flexibility make it a strong contender for many.
For DevOps teams, SolarWinds provides critical insights into the performance and health of applications throughout the software development lifecycle. Imagine you’re deploying a new feature using a blue-green deployment strategy. SolarWinds can monitor the performance of both the blue and green environments, providing real-time data on key metrics like response time, error rates, and resource utilization. This allows you to quickly identify and address any performance issues before they impact end-users. Learn more about SolarWinds and how it can be integrated into your deployment workflows. This real-time visibility is crucial for ensuring a smooth and successful deployment.
SolarWinds offers a wide range of modules catering to specific monitoring needs. Network Performance Monitor (NPM) provides comprehensive network monitoring, including device discovery, performance analysis, and traffic flow analysis. Server & Application Monitor (SAM) dives into application and server health, monitoring resource usage, application dependencies, and performance bottlenecks. Database Performance Analyzer (DPA) helps optimize database performance by identifying slow queries and resource contention. These modules, combined with others like Log Analyzer and Security Event Manager, create a powerful ecosystem for observing and managing IT infrastructure.
One of SolarWinds’ key strengths is its user-friendly interface. The dashboards are highly customizable, allowing DevOps teams to tailor the views to their specific needs. The visualization capabilities are also strong, making it easy to identify trends and anomalies in performance data. This is especially beneficial for React Native app developers and product managers seeking real-time insights into application performance. They can create custom dashboards that display key metrics related to app usage, crashes, and performance, allowing them to proactively identify and address issues.
However, this powerful platform comes with a few caveats. The modular nature of SolarWinds, while providing flexibility, can lead to significant costs, especially for smaller organizations. Each module requires separate licensing, which can quickly add up. Additionally, while the platform generally performs well, very large and complex environments can sometimes see performance degradation. Furthermore, while SolarWinds offers robust traditional infrastructure monitoring, its support for modern DevOps tools and technologies, such as containerization and orchestration platforms like Kubernetes, is somewhat limited compared to newer, cloud-native monitoring solutions. This is an area where SolarWinds could improve to better serve the evolving needs of DevOps teams.
While pricing information isn’t publicly available and requires contacting SolarWinds directly, it’s generally understood that the pricing scales with the number of monitored elements and the modules selected. Technical requirements also vary depending on the modules being used, but generally involve server resources for the central Orion platform and agents deployed on monitored systems.
For teams considering implementing SolarWinds, a few tips can help streamline the process. Start with a clear understanding of your monitoring needs and prioritize the modules accordingly. Begin with a smaller deployment to familiarize yourself with the platform and then scale up as needed. Leverage the extensive documentation and community resources available to get the most out of the platform. Consider starting with a trial version to evaluate its suitability for your specific environment and use cases. By carefully planning and implementing SolarWinds, DevOps teams can gain valuable insights into their infrastructure and applications, enabling them to improve performance, enhance reliability, and deliver better user experiences.
10. Dynatrace
Dynatrace is an AI-powered, full-stack monitoring platform designed to provide comprehensive observability into complex, dynamic, and cloud-native environments. It distinguishes itself from other monitoring tools for DevOps through its automatic discovery and dependency mapping capabilities, coupled with AI-driven insights and automated root cause analysis. This makes it an ideal solution for organizations struggling to manage the complexity of modern application architectures and seeking to accelerate their DevOps workflows. Dynatrace is particularly well-suited for DevOps teams dealing with microservices, Kubernetes, and cloud-native technologies, offering a single pane of glass for monitoring everything from infrastructure to user experience.
For React Native app developers, Dynatrace offers session replay and real user monitoring, providing invaluable insights into actual user behavior and application performance in real-world scenarios. DevOps and release engineers benefit from the automated root cause analysis, which drastically reduces the time it takes to identify and resolve performance bottlenecks and outages. QA and beta testing teams can leverage Dynatrace’s synthetic monitoring to proactively identify potential issues before they impact real users. Security-conscious enterprise organizations can use Dynatrace to monitor security vulnerabilities and compliance issues. Finally, product managers gain access to real-time insights into application performance, enabling data-driven decisions about feature development and prioritization.
Dynatrace automatically discovers and maps all components of your technology stack, eliminating the need for manual configuration and ensuring comprehensive coverage. This includes infrastructure components, application services, databases, and even third-party APIs. It provides full-stack monitoring, tracking metrics from the underlying infrastructure all the way up to the user experience, enabling teams to quickly identify the root cause of performance issues. The platform’s AI engine analyzes this vast amount of data to provide actionable insights and automate tasks like root cause analysis. Dynatrace also offers real user monitoring (RUM) and synthetic testing, providing a comprehensive view of application performance from both the user’s perspective and under simulated load. These capabilities make it an excellent monitoring tool for DevOps teams seeking to optimize application performance, improve reliability, and accelerate their development cycles.
One of Dynatrace’s key strengths lies in its AI-driven insights. Unlike traditional monitoring tools that simply collect and display metrics, Dynatrace leverages its Davis AI engine to analyze data, identify anomalies, and pinpoint the root cause of problems automatically. This eliminates the need for manual investigation, freeing up valuable time for DevOps engineers to focus on other tasks. For instance, if a slowdown occurs in a specific microservice, Dynatrace automatically identifies the affected service, analyzes the underlying infrastructure and code, and pinpoints the root cause, such as a database query bottleneck or a code defect. This level of automation is invaluable for managing complex, distributed systems.
While Dynatrace offers powerful features and automation, it’s essential to consider its potential drawbacks. The platform’s premium pricing can be a significant investment, especially for smaller organizations or those with simpler monitoring needs. While the auto-discovery feature minimizes initial configuration, taking full advantage of Dynatrace’s advanced AI capabilities may involve a learning curve. Finally, compared to open-source tools, Dynatrace offers less flexibility in terms of customization.
Implementing Dynatrace typically involves deploying a OneAgent on your infrastructure and application servers. This agent automatically discovers and monitors all components of your technology stack. For cloud environments, Dynatrace integrates seamlessly with popular cloud providers like AWS, Azure, and Google Cloud Platform. While Dynatrace aims to minimize manual configuration, it is important to understand the platform’s capabilities and tailor them to your specific monitoring needs. This may involve defining custom dashboards, setting up alerts, and integrating with other DevOps tools.
In comparison to other monitoring tools like Datadog or New Relic, Dynatrace places a stronger emphasis on AI-driven insights and automated root cause analysis. While these other platforms offer similar features like infrastructure monitoring and application performance monitoring, Dynatrace’s AI engine provides a level of automation and intelligence that sets it apart, particularly for complex, dynamic environments.
For more information and specific pricing details, visit the Dynatrace website: https://www.dynatrace.com
Top 10 DevOps Monitoring Tools Comparison
| Solution | Core Features ✨ | User Experience ★★★★☆ | Value Proposition 💰 | Target Audience 👥 | Unique Selling Points 🏆 |
|---|---|---|---|---|---|
| Prometheus | Multi-dimensional metrics, PromQL, Alertmanager | Reliable, scalable, steep learning curve | Free & open-source 💰 | DevOps, microservices teams 👥 | Powerful query language, extensive ecosystem ✨ |
| Grafana | Multi-source visualization, customizable dashboards | Excellent UI, great visualization | Free & enterprise options 💰 | Infrastructure & app monitoring 👥 | Best-in-class dashboards, large plugin library 🏆 |
| Datadog | Full-stack monitoring, AI anomaly detection | User-friendly, strong integrations | Premium, can be costly 💰 | Enterprises with complex stacks 👥 | AI-powered insights, wide integrations 🏆 |
| New Relic | APM with tracing, AI intelligence | Strong APM, proactive detection | Paid tiers, high pricing 💰 | Enterprises & software teams 👥 | Comprehensive full-stack observability 🏆 |
| Nagios | Network/server/app monitoring, plugin ecosystem | Mature, solid but dated UI | Free & commercial versions 💰 | IT ops teams, legacy users 👥 | Extensive plugin support, battle-tested ✨ |
| Elastic Stack | Log ingestion, search, Kibana dashboards | Powerful visualization, resource-intensive | Open core, costly enterprise 💰 | Log analysts, big data teams 👥 | Scalable log analytics with ML anomaly detection 🏆 |
| Zabbix | Agent-based/agentless, real-time monitoring | Feature-rich, complex setup | Free & open-source 💰 | Large enterprises, network admins 👥 | Enterprise features, automated discovery ✨ |
| AppDynamics | Business transaction & user monitoring | Detailed APM, business context | Expensive licensing 💰 | Large enterprises & businesses 👥 | Business impact analysis, AI analytics 🏆 |
| SolarWinds | Network/app/database monitoring | User-friendly, good visualization | Moderate to high cost 💰 | IT ops & infrastructure teams 👥 | Flexible deployment, network mapping ✨ |
| Dynatrace | AI discovery, full-stack, root cause analysis | Minimal setup, AI insights | Premium pricing 💰 | Cloud-native & large enterprises 👥 | AI-driven automated root cause analysis 🏆 |
Choosing the Perfect Monitoring Tool for Your DevOps Team
Selecting the right monitoring tools for devops from the array of options discussed – Prometheus, Grafana, Datadog, New Relic, Nagios, Elastic Stack (ELK), Zabbix, AppDynamics, SolarWinds, and Dynatrace – is crucial for any successful DevOps strategy. Your ultimate choice depends on several key factors. Consider your team’s technical expertise and the specific metrics you need to track. Budget constraints play a significant role, as do the complexities of your existing infrastructure setup. Remember, effective monitoring tools for devops involve not only collecting data but also analyzing it to glean actionable insights.
Key takeaways include understanding the strengths of each tool. While some offer unified platforms for comprehensive monitoring, such as Datadog and Dynatrace, others like Prometheus and Grafana provide open-source flexibility and cost-effectiveness, enabling customization and deeper integration with your existing systems. Often, a combination of tools is necessary to achieve comprehensive monitoring across different areas of your application and infrastructure.
Implementing these monitoring tools requires careful planning. Consider factors like scalability, ease of integration with your current workflows, and the level of alerting and reporting required. Start with clearly defined goals, focusing on the metrics that matter most to your application’s performance and user experience. Don’t just gather data – translate that data into actionable improvements.
Building a robust monitoring strategy with the right monitoring tools for devops empowers your team to identify and address performance bottlenecks, proactively prevent outages, and continuously optimize your applications. This leads to faster debugging, quicker deployments, and ultimately, a smoother, more successful software development process.
Streamline your development lifecycle further by integrating a robust OTA update solution like CodePushGo. CodePushGo complements your monitoring tools for devops, allowing you to react quickly to issues and deploy critical updates seamlessly without disrupting the user experience. Explore how CodePushGo can enhance your DevOps workflow by visiting CodePushGo today.